Curated OER
Measurement and Data Collecting using Image Processing
Students trace the route of the historical event and measure the distance over which the people involved journeyed. A data sheet be constructed outlining the location of events, and the speed with which the journey occurred.
Curated OER
Gathering Data to Problem Solve
Learners, while using reading and writing strategies (subheads, prediction, skim, details, drawing inferences, etc,), solve math problems that involve gathering and representing data (addition, subtraction, multiplication). They practice...
Curated OER
The Way to Better Grades!
Pupils collect and analyze data. In this statistics lesson, learners create a scatter plot from their collected data. They use, tables and graphs to analyze the data and mae decisions.
Curated OER
Bungee Jump Lab
Student apply linear relationships to the real world. They use Ken and Barbie dolls and experiment to find the line of best fit. They collect data, analyze data, and make predictions from it. The students also use Microsoft Power Point...
Omaha Zoo
I Like to Move It
What do lemurs do best? They move! Lemurs like to jump, run, hop, and climb and it's your class's job to document seven fun lemur behaviors. The class starts by discussing why lemurs are considered primates, and then they isolate seven...
University of Georgia
Heating and Cooling of Land Forms
Compare heating and cooling rates of different land forms. A lab activity has groups collect data on the rate of heating and cooling of soil, grass, saltwater, fresh water, and sand. An analysis of the rates shows how the different land...
Curated OER
Chapter 35: Labor-Market Issues - Unionism, Discrimination, and Immigration
A discussion on American unions, employment discrimination, and collective bargaining transitions into a larger conversation about the workforce. A graph that details the amount of immigrants from various countries will surely get your...
NOAA
Through Robot Eyes
How do robots assist ocean explorers in collecting data and images? The final installment in a five-part series has science scholars examine underwater images collected by robots and identify the organisms shown. Groups then calculate...
Curated OER
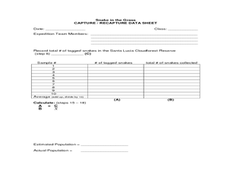
Snake in the Grass: Capture/Recapture Activity
Learners estimate the total number of species in Ecuador using the capture/recapture method. They collect data about each species and act as members of a science expedition to determine the total number of species by using mathematical...
Curated OER
Exploring Quadratic Data with Transformation Graphing
Using a data collection device to collect data regarding a bouncing ball, students use various features on graphing calculators to experiment with the parameters of the vertex form of the parabola and their effect on the shape of the...
Curated OER
Data and Probability: What is the Best Snack?
In this math/nutrition lesson, the nutritional value of 3 snack foods is recorded on a data chart and represented on a bar graph. Students analyze and compare information, construct data charts and related bar graphs, and draw...
Curated OER
Agriculture and the Government
Students study the government's involvement in the U.S. A's food production and make connections relating to farm programs. In this historical agriculture lesson, students read content and research significant information. Students then...
Curated OER
The Collection
Learners consider the impact of museum collections. In this global studies lesson, students read an article and contribute to group discussions that analyze what a collection is. The article is not included with the lesson.
Curated OER
Collecting Stamps
Second graders observe and demonstrate how to count by hundreds and the process of using ones, tens, and hundreds to make numbers. They read and discuss a story from their Math Storybook, and follow along with problems on an activity...
Curated OER
Creating a Leaf Collection and Classroom Herbarium
Students categorize leaves they collect from trees outdoors by consulting a variety of sources. They discuss how the form of a leaf reflects its adaptation to its environment.
Curated OER
Collecting and Recording Data# O
Students observe plants growing over time, measure specific plant growth, and gather and record data on plan growth.
Curated OER
Collective Behavior and Social Movements
In this collective behavior and social movements worksheet, young scholars match 15 vocabulary terms to the appropriate descriptions and answer 6 multiple choice questions regarding the 2 sociology topics.
Curated OER
Wiggle Worms
First graders investigate worms, collect and analyze data. In this worm and data lesson, 1st graders listen to Chick and Duckling from the Macmillan/McGraw-Hill reading series. They conduct experiments with worms, collect simple data,...
Curated OER
Beach Cleanup at a Local Beach
Students participate in an environmental clean-up activity. In this environmental lesson, students travel to a local beach. Working in small teams, students collect trash from the local beach. Returning to school, students sort the trash...
Curated OER
Great Graphing
Students collect data, use a computer spreadsheet program to create various graphs, and compare the graphs. They state the findings of each graph in writing and decide which graph type best represents the data.
Curated OER
The Effect of Acid Rain on Limestone
Pupils investigate the pH of rain water in this earth science lesson. They collect rain water from their area and explore the pH when lime stone is added, then they will use the data collected to conjecture as to the effect of acid rain...
Curated OER
Data! Data! Graph that Data!
Fifth graders create data graphs using Microsoft Excel. For this data collection lesson, 5th graders create and conduct a survey, then use Excel to organize and graph their data.
Curated OER
Weather
Students create a spreadsheet and chart using data collected. In this weather lesson, students select five cities from their state, including the city they live in. Students take daily temperature readings from all five cities. ...
Texas Instruments
Light and Day
Pupils explore the concept of collecting data as they collect data on their graphing calculator about time, temperature, and light. Learners plot the data and create histograms and box and whisker plots to analyze the data.
Other popular searches
- Data Collection
- Collecting Data
- Lesson Plan Collections
- Collecting and Recording Data
- Collect Data
- Data Collection Techniques
- Botany Collection
- Math Lessons Data Collection
- Data Collection Activity
- Leaf Collection
- Data Sets Data Collection
- Thematic Unit Collections


