C-SPAN
Big Data and Politics
Movie selection means more than entertainment. Learners consider what information Netflix gathers to understand the concept of "big data." Resource includes clips of experts talking about corporations that harvest the details of our...
Council for Economic Education
GDP Data: Is the Economy Healthy?
Does the economy needs a check-up? Scholars analyze the gross domestic product (GDP) to determine the overall health of the current economy. They use a short video clip as well as economic data to determine the current growth of the...
Curated OER
Eastern European Studies
One worksheet, three projects. Learners explore Eastern Europe and mark Eastern European countries on a map. They then collect and record census data on thirteen different countries, and write a 3-5 page expository essay on one of the...
Curated OER
Energy Audit
Young scholars collect data about energy usage and use mathematical calculations to analyze their data. In this energy conservation and statistics math lesson, students survey their homes to complete an energy usage worksheet. Young...
Curated OER
Student News And Weather Channel
Fabulous! Your 5th graders should love this project. As an ongoing lesson throughout the year students use temperature probes to record outside temperature and then document their data using spreadsheets. They use their weather data and...
Curated OER
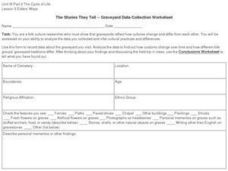
The Stories They Tell -- Graveyard Data Collection Worksheet
In this folk culture research worksheet, students use the form to record data about a graveyard that they visit to show that graveyards reflect how cultures change and differ from each other.
Curated OER
Measurement and Data Collecting using Image Processing
Young scholars trace the route of the historical event and measure the distance over which the people involved journeyed. A data sheet be constructed outlining the location of events, and the speed with which the journey occurred.
Council for Economic Education
Economic Data Lesson: Economic Policy Options
Can you make decisions that will impact millions of people around the nation? Scholars research the role of the Federal Reserve, and its Chairman, on the economic outlook of the country. They analyze current trends in unemployment,...
Council for Economic Education
Employment Data: Is the Economy Healthy?
Low unemployment is an indicator of a healthy economy—right? Current employment data and research leads scholars on a quest to find the true health of the economy. They analyze research on Payroll Employment Data and watch a short video...
Council for Economic Education
Unemployment Data: Is the Economy Healthy?
The United States will never see a time when the unemployment rate hits 0%. Why? Scholars research economic data to uncover clues hidden in the unemployment rate at any given time. A short video as well as research activities help...
Council for Economic Education
Inflation Data: Is the Economy Healthy?
What stories do current trends tell about society, fashion, and the future? Scholars investigate the concept of inflation and its impact on the future of the American economy. They compile current economic data to determine the level of...
Curated OER
Twelve Days of Christmas--Prediction, Estimation, Addition, Table and Chart
Scholars explore graphing. They will listen to and sing "The Twelve Days of Christmas" and estimate how many gifts were mentioned in the song. Then complete a data chart representing each gift given in the song. They also construct...
Curated OER
Graphing and Analyzing Biome Data
Students explore biome data. In this world geography and weather data analysis lesson, students record data about weather conditions in North Carolina, Las Vegas, and Brazil. Students convert Fahrenheit degrees to Celsius degrees and use...
Federal Reserve Bank
“Dewey Defeats Truman”: Be Aware of Data Revisions
Discover the impact and importance of data releases about current economic conditions in the United States. Your class members will learn about data revision and the GDP, and how these figures can alter people's views on the economy.
Curated OER
Obstacles to Success: Misleading Data
Eleventh graders explore how data reported by country agencies can mislead the public intentionally or unintentionally. For this Cross Curricular activity, 11th graders analyze charts and graphs in order to draw conclusions. Students...
Living Rainforest
Finding the Rainforests
From Brazil to Indonesia, young scientists investigate the geography and climate of the world's tropical rain forests with this collection of worksheets.
Curated OER
Surname Survey
Students use data from the U.S. Census Bureau to determine whether last names in a local phone directory reflect the Census Bureau's list of the most common surnames in the country. In this surnames lesson plan, students use the Internet...
Curated OER
Excel Lesson
Students explore data and Excel spreadsheets. They collect data about political candidates. Students enter the data into a chart on Excel. They create a graph using the data and Excel.
Curated OER
Your Tax Dollars at Work
In order to understand how tax dollars are spent, young economists use given data and graph it on a circle graph. Circle graphs are highly visual and can help individuals describe data. A class discussion follows the initial activity.
Curated OER
Tides at the Battery, NY
Skill in using Excel and increasing proficiency in manipulating data are challenged with this data analysis work. A web link supplies data and step-by-step instructions help learners create a graph. There are many extension...
Curated OER
Social Change
Young scholars study a social issue involving gorillas, and work in groups to develop strategies to increase awareness of and problem solve a solution for the issue. They collect data using handheld computers and write a report.
Curated OER
Data Collection
Young scholars explore the reason for collecting and analyzing facts and figures or data and statistics. They show how data can be used to help us to solve real life problems and plan for the future. Students use everyday problems that...
Curated OER
"Lucky Charms": Interpreting Data and Making Predictions
Seventh graders determine if a "lucky charm" will increase their chances of winning a game. Students calculate the experimental probability of each player in a game. They observe and collect data from each activity. Students compare the...
Curated OER
The Gathering and Analysis of Data
Young mathematicians gather data on a topic, graph it in various forms, interpret the information, and write a summary of the data. They present their data and graphs to the class.


