American Statistical Association
What Fits?
The bounce of a golf ball changes the result in golf, mini golf—and a great math activity. Scholars graph the height of golf ball bounces before finding a line of best fit. They analyze their own data and the results of others to better...
Charleston School District
Analyzing Scatter Plots
Scatter plots tell a story about the data — you just need to be able to read it! Building from the previous lesson in the series where learners created scatter plots, they now learn how to find associations in those scatter plots. They...
EngageNY
Differences Due to Random Assignment Alone
It takes a lot of planning to achieve a random result! Learners compare results of random assignment, and conclude that random assignment allows results to be attributed to chance. They also realize the set of random means are clustered...
Curated OER
Busy Bees: Counting from 11-19
This worksheet has learners solve five problems in which groups of 10 pictured items are circled and the rest counted. Pupils write the number (under 20). What distinguishes this work from other counting worksheets is that the objects...
Curated OER
Mathematics Within: Algebraic Processes and Its Connections to Geometry
Students analyze multiple strategies of multiplication: clustering, area model, breaking apart/decomposing, etc. They create their own strategies to approaching multiplication problems and share them with their classmates. Discussion...
Inside Mathematics
Scatter Diagram
It is positive that how one performs on the first test relates to their performance on the second test. The three-question assessment has class members read and analyze a scatter plot of test scores. They must determine whether...
Inside Mathematics
House Prices
Mortgages, payments, and wages correlate with each other. The short assessment presents scatter plots for young mathematicians to interpret. Class members interpret the scatter plots of price versus payment and wage versus payment for...
Curated OER
Number Sense
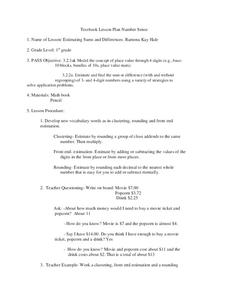
First graders practice rounding 4 digit numbers using place value concepts. In this estimating sums and differences lesson plan, 1st graders explore clustering, rounding, and front end estimation as methods for rounding decimals.
American Statistical Association
You and Michael
Investigate the relationship between height and arm span. Young statisticians measure the heights and arm spans of each class member and create a scatter plot using the data. They draw a line of best fit and use its slope to explain the...
American Statistical Association
How Tall and How Many?
Is there a relationship between height and the number of siblings? Classmates collect data on their heights and numbers of brothers and sisters. They apply statistical methods to determine if such a relationship exists.
American Statistical Association
Scatter It! (Predict Billy’s Height)
How do doctors predict a child's future height? Scholars use one case study to determine the height of a child two years into the future. They graph the given data, determine the line of best fit, and use that to estimate the height in...
American Statistical Association
Scatter It! (Using Census Results to Help Predict Melissa’s Height)
Pupils use the provided census data to guess the future height of a child. They organize and plot the data, solve for the line of best fit, and determine the likely height and range for a specific age.
Curated OER
Interpreting and Displaying Sets of Data
Students explore the concept of interpreting data. In this interpreting data lesson, students make a line plot of themselves according to the number of cubes they can hold in their hand. Students create their own data to graph and...
Curated OER
Data Scavenger Hunt
Eighth graders discuss how data is collected and participate in data collection through a survey. They complete a scavenger hunt on the Internet to gain understanding of the data measures mean, median, mode, and range.
Curated OER
Lunar Meteorite Impact Risks
In this lunar meteorite impact worksheet, students read about the dangers of meteorite impacts while exploring the moon. Students solve 7 problems including finding the area of the side of the moon that faces the Earth, calculating the...
Albert Shanker Institute
Economic Causes of the March on Washington
Money can't buy happiness, but it can put food on the table and pay the bills. The first of a five-lesson unit teaches pupils about the unemployment rate in 1963 and its relationship with the March on Washington. They learn how to create...
Curated OER
My Peanut Butter is Better Than Yours!
Students explore the concept of statistical data. For this statistical data lesson, students read an article about the dangers of peanut butter to those who are allergic. Students perform a taste test of two different brands of peanut...
Alabama Learning Exchange
The State Capital of Stem and Leaf
Students explore the concept of stem and leaf plots. In this stem and leaf plots lesson, students plot the 50 US states' capitals on a stem and leaf plot according to the first letter of each state. Students compare their stem and leaf...
Curated OER
Add & Subtract Fractions w/Unlike Denominators, 2
Students use several examples to create a method for adding and subtracting fractions with unlike denominators. They present these methods to the class and then practice applying methods to sample problems.
Curated OER
Investigating Median, Mode, and Mean
Learners develop strategies to organize data while following teacher demonstration. They calculate the mean, median and mode of a data set while determining the relationships between the numbers. They analyze data from tables and double...
Curated OER
Pythagorean Theorem Investigation
Eighth graders investigate the Pythagorean Theorem and practice applying the theorem to various triangles. Finally, in the next lesson in the sequence, 8th graders create a song or a story to help them remember the Pythagorean Theorem.
Howard Hughes Medical Institute
Seed Dispersal in Tropical Forests
How do seeds get around? It's not like plants can control seed dispersal—or can they? Dig deeper into the amazing mechanisms of seed dispersal observed in tropical plants through interactives, a video, and plenty of hands-on data...


