Curated OER
A Comparison of Cloud Coverage Over Africa
Students use a NASA satellite data to contrast amounts of cloud coverage over different climate regions in Africa. They explore how Earth's major air circulations affect global weather patterns, and relate to local weather patterns.
Curated OER
A Comparison of Cloud Coverage over Africa
Learners identify different climate regions and local weather patterns. In this cloud coverage lesson students use NASA satellite data and import it into Excel.
Curated OER
Does Humidity Affect Cloud Formation?
Students use S'COOL data to identify factors that affect cloud formation. They find a data set using the S'COOL database , and use Excel to manipulate the data. Student isolate relevant data, create meaningful graphs from a spreadsheet,...
Curated OER
Deep Convective Clouds
Students observe clouds. In this deep convective clouds lesson, students analyze cloud data recorded over one month and draw conclusions based on results. Students predict "Thunderstorm Season" and prepare to defend their decision...
Curated OER
Aruba Cloud Cover Measured by Satellite
Learners analyze cloud cover and compose written conclusions to a given related scenario. Students submit a letter of response and a report detailing their calculations and conclusions.
Curated OER
Measuring Cloud Coverage
Students explore Earth science by completing weather symbol worksheets. In this cloud identification lesson plan, students identify the different types of clouds in the sky and how they are formed. Students complete a cloud measurement...
Curated OER
Seasonal Cloud Cover Variations
Young scholars, in groups, access data from the NASA website Live Access Server regarding seasonal cloud coverage and the type of clouds that make up the coverage. They graph the data and make correlations between types, seasons and...
Curated OER
The Atmosphere
Here is a suitable set of slides to use when teaching about the layers of the atmosphere, climate, global winds, and types of clouds. These slides will support a few different lectures. You will probably want to replace the diagrams with...
Curated OER
Storm Clouds-- Fly over a Late Winter Storm onboard a NASA Earth Observing Satellite
Students study cloud data and weather maps to explore cloud activity. In this cloud data lesson plan students locate latitude and longitude coordinates and determine cloud cover percentages.
Curated OER
What's Up? Clouds and Your Weather
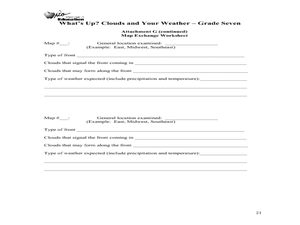
Seventh graders identify clouds and the weather that is associated with them. For this weather lesson students work in groups and design their own weather map.
Curated OER
Seasons and Cloud Cover, Are They Related?
Young scholars use NASA satellite data to correlate cloud cover over Africa to the solar declination.
Curated OER
Cloud Discovery
Students create a HyperStudio stack that describes and illustrates twelve different kinds of clouds. They then make inferences about which types of weather the different types of clouds could help predict.
Curated OER
Clouds and Solar Radiation
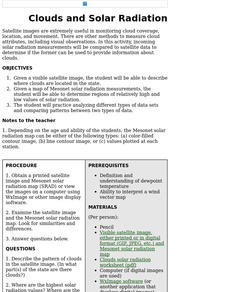
Students examine how clouds affect incoming solar radiation. They compare and contrast satellite images and incoming solar radiation measurements as methods to provide information about clouds.
Curated OER
Aruba Cloud Cover Measured by Satellite
Students analyze cloud cover over Aruba. They compose and submit written conclusions which include data, analysis, errors in data collection, and references.
Curated OER
Seasonal Cloud Cover Variations
Students recognize different cloud types. They determine the seaonality of various types of clouds. They graph the data and determine if a correlation exists between season, cloud cover and type of clouds most prevalent during each season.
Curated OER
Clouds and Your Weather
Seventh graders identify clouds and the weather associated with them. They use informational articles and personal weather observations to learn about the relationships between weather fronts and clouds.
Curated OER
Clouds and Solar Radiation
Students use satellite imaging and Mesonet solar radiation maps to answer questions given to them by the teacher and look for differences and similiarities in the data.
National Wildlife Federation
I’ve Got the POWER! Solar Energy Potential at Your School
Should every school have solar panels? The 19th lesson in a series of 21 has scholars research the feasibility of using solar panels at their school. They begin by gathering data on the solar energy in the area before estimating the...
Curated OER
Snow Cover by Latitude
Learners create graphs showing the amount of snow coverage at various points of latitude and compare graphs.
Curated OER
Geography: Snow Cover on the Continents
Students create maps of snow cover for each continent by conducting Internet research. After estimating the percentage of continental snow cover, they present their findings in letters, brochures or Powerpoint presentations.
Curated OER
Solar Cell Energy Availability From Around the Country
Students determine areas that are the most likely to produce solar energy by using NASA data. In this solar energy lesson students analyze plots and determine solar panel use.
Curated OER
Creating a Thematic Map
Students create and analyze a weather-related data table and a thematic map based upon information provided.
Curated OER
Think GREEN - Utilizing Renewable Solar Energy
Learners use data to find the best renewable energy potential. In this solar energy lesson students import data into Excel and explain how solar energy is beneficial.
Curated OER
Comparison of Snow Cover on Different Continents
Students use the Live Access Server (LAS) to form maps and a numerical text file of snow cover for each continent on a particular date and analyze the data for each map, corresponding text file to determine an estimate of snow cover for...


