Other
The Topic: Charts and Graphs
Brief descriptions of charts and graphs, followed by links to larger sites on the same subject.
US Department of Education
National Center for Education Statistics: Create a Graph Tutorial
This tutorial walks students through how to create different types of graphs using the Create a Graph tool available on the website. Covers bar graphs, line graphs, pie charts, area graphs, scatter plots, and dependent and independent...
Scholastic
Scholastic: Bars, Lines, and Pies
Students will learn and reinforce skills for creating, applying and analyzing pie charts, bar graphs and line graphs.
Richland Community College
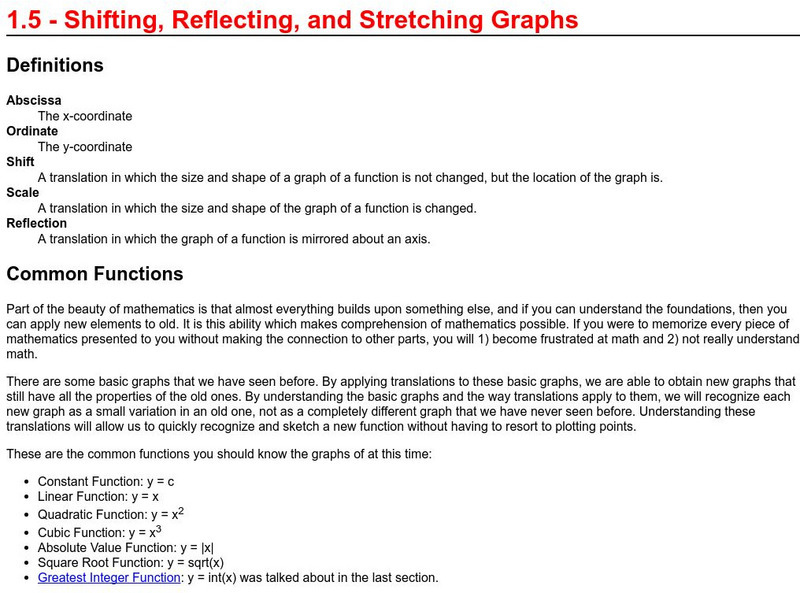
Richland Community College: Shifting, Reflecting, Stretching Graphs
This site provides everything you need to know about translating graphs. Plenty of examples and charts and very easy to understand.
Utah Education Network
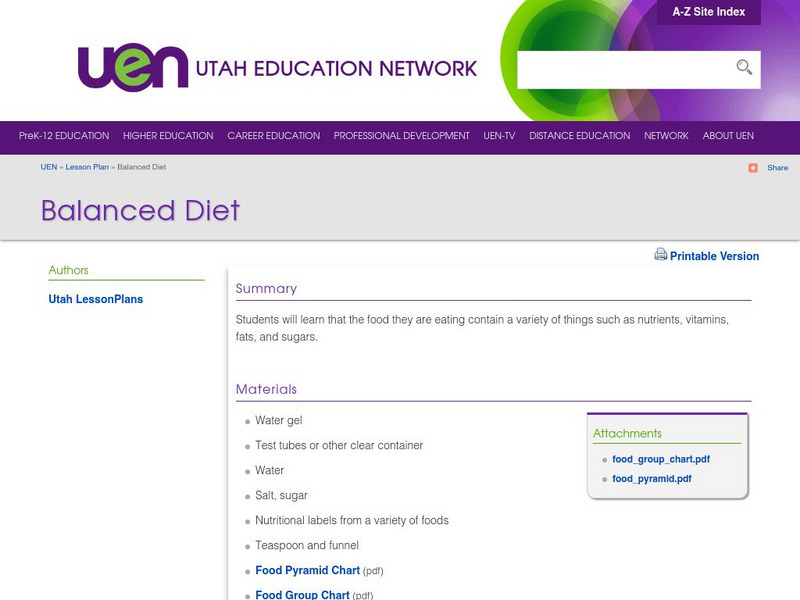
Uen: Balanced Diet
In this lesson, 2nd graders will learn about the components of a balanced diet. Students will analyze charts and then self-report their own foods in categories. Several fiction and nonfiction books are listed as additional resources.
University of Texas
Inside Mathematics: Parking Cars [Pdf]
This task challenges a student to use their understanding of scale to read and interpret data in a bar graph.
Lumen Learning
Lumen: Critical Reading: Specialized Reading Strategies
This lesson focuses on specialized reading strategies such as online reading, reading in math, science, etc., and reading charts and graphs. It provides text, videos, charts and graphs, graphics, and a self-check.
Utah Education Network
Uen: Recording Local Weather
Second graders will measure, record, graph and report changes in local weather utilizing Navajo, Ute, and Spanish words.
Florida Center for Reading Research
Florida Center for Reading Research: Essentials for Reading Success
This site offers three cyclical flow charts of the essentials for reading success: components of reading, types of assessment, and layers of instruction.
Other
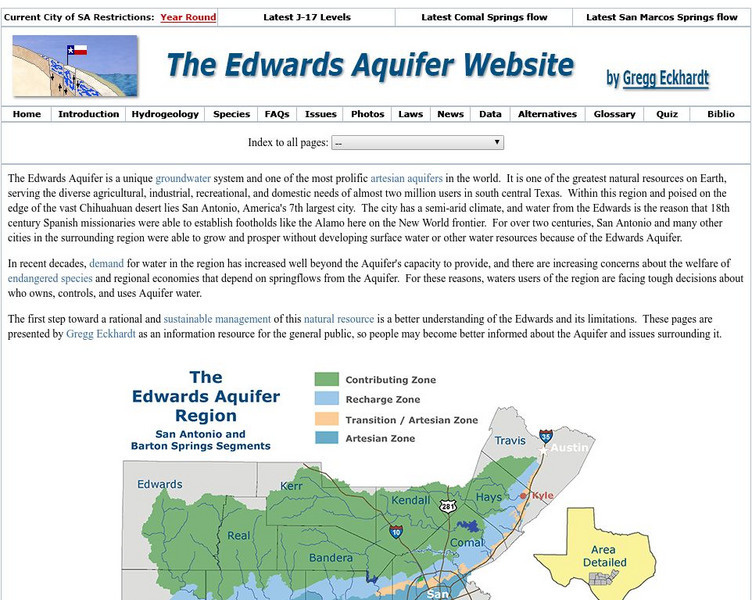
The Edwards Aquifer: Homepage
In hopes of informing the citizens of the Edwards Aquifer region, Gregg Eckhardt has set up a site presenting facts about the Edwards Aquifer in Texas. Included are links to questions and answers, endangered species, charts and graphs,...
Texas Education Agency
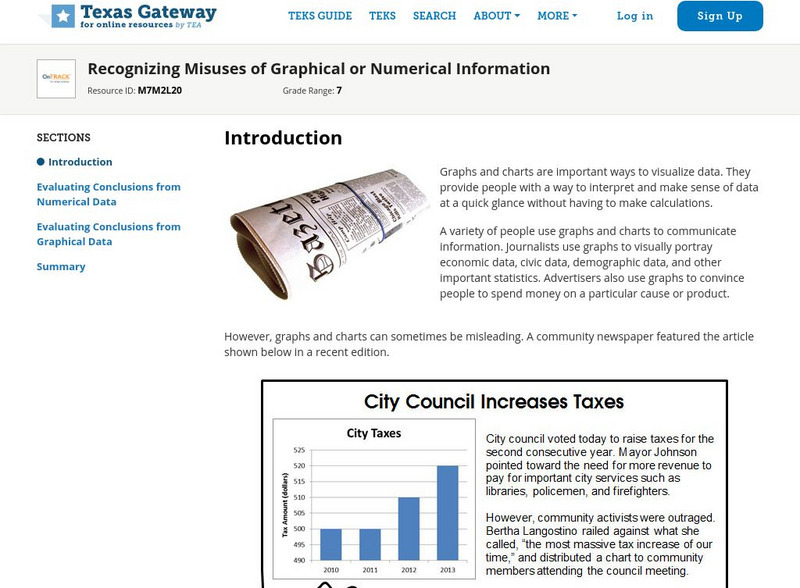
Texas Gateway: Recognizing Misuses of Graphical or Numerical Information
Given a problem situation, the student will analyze data presented in graphical or tabular form by evaluating the predictions and conclusions based on the information given.
Virtual Salt
Virtual Salt: Ideas for Enhancing Oral Reports
A helpful review of important parts of your report and ways to strengthen it. SL.9-10.4 Presentation
CK-12 Foundation
Ck 12: Types of Data Representation: Graphic Displays of Data
[Free Registration/Login may be required to access all resource tools.] Here you will explore displays of data using bar charts, histograms, pie charts and boxplots, and learn about the differences and similarities between them and how...
Alabama Learning Exchange
Alex: Ice Cream Sundae Survey
Learners quickly realize the importance of learning how to read and find information in charts, graphs, and tables compared to finding the same information written in a paragraph. This is a fun, high energy lesson!This lesson plan was...
Read Works
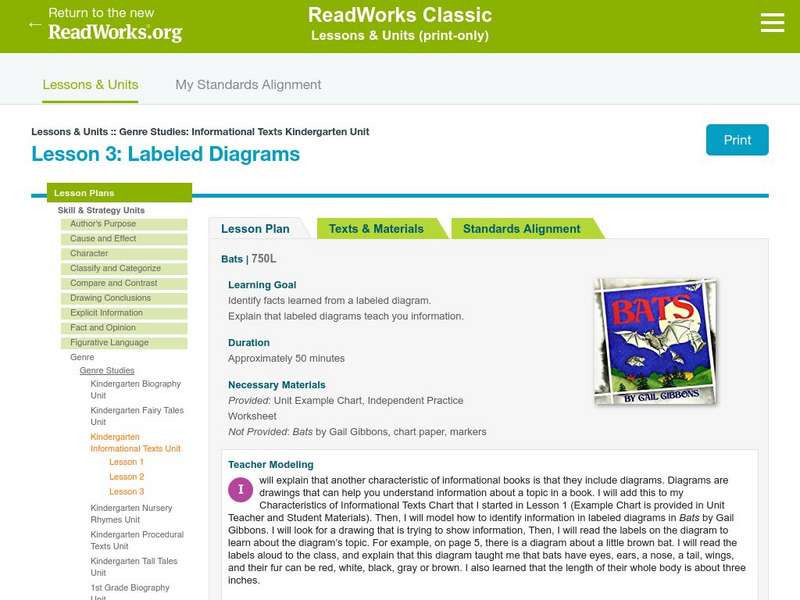
Read Works: Genre Studies: Informational Text Kindergarten Unit: Labeled Diagrams
[Free Registration/Login Required] Lesson uses Bats by Gail Gibbons to teach learners how to identify facts learned from labeled diagrams within an informational text. Ideas for direct teaching, guided practice, and independent practice...
Robert Schenk, PhD
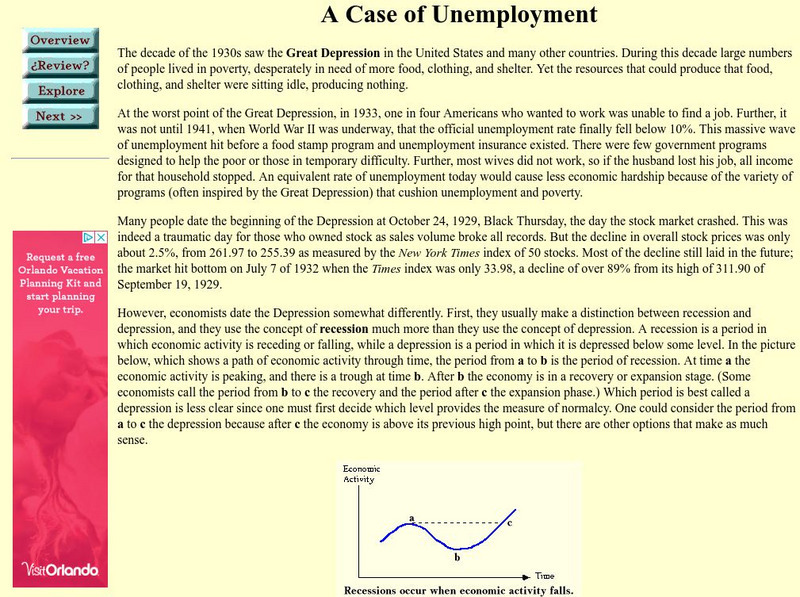
Cyber Economics: Intro to Macro: A Case of Unemployment
Case study of unemployment and the economy of the Great Depression offers analysis and postulates theoretical outcomes. With charts and graphs.
Other
Stat Trek: Data Patterns in Statistics
This lesson looks at how to recognize patterns in a data display by examining the shape of a graph, the center, the spread, and unusual features such as outliers. Includes video. [11:16]
Simon Fraser University
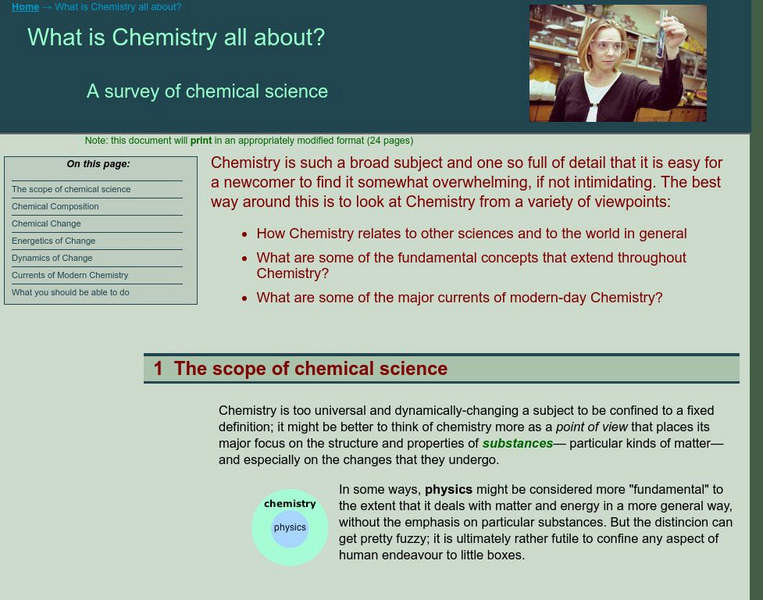
Chem1 Virtual Textbook: What Is Chemistry All About?
Covering a range of eight topics related to chemistry, this resource provides a wealth of information complete with pictures, charts, graphs, and examples. Includes information on elements, compounds, atoms, molecules, structures,...
Virginia History Series
Virgina History Series: Virginia State History Post Wwii to Present Day [Pdf]
Visualize the major events in the last half of the 20th century such as major wars and civil rights issues through the lens of the state of Virginia. In addition, learn about the pop culture of this time specifically in Virginia. Enjoy...
Pew Research Center
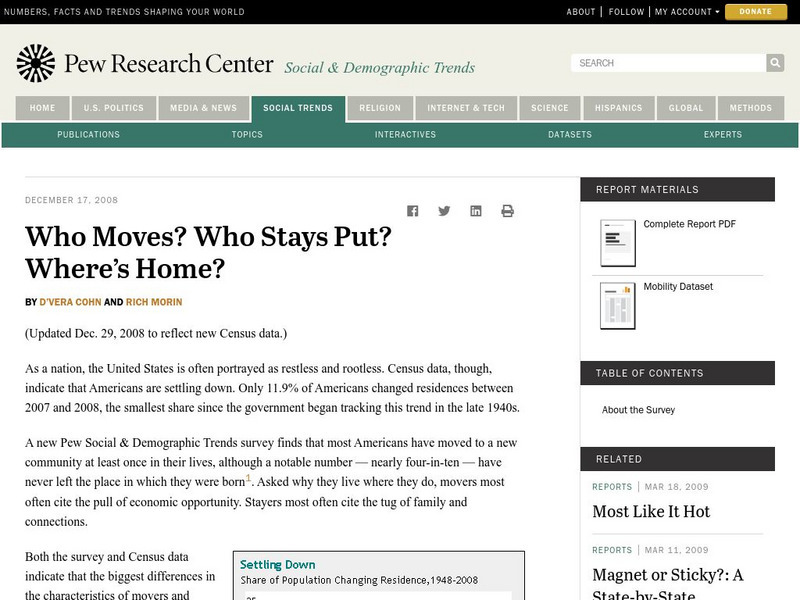
Pew Social and Demographic Trends: Migration Flows in the United States
The Pew Hispanic Research Center details the migration flows of the United States. Breaks down U.S. migration patterns from the last 20 years. Scroll mouse over map to see the regional migration throughout the years. View a map which...
NOAA
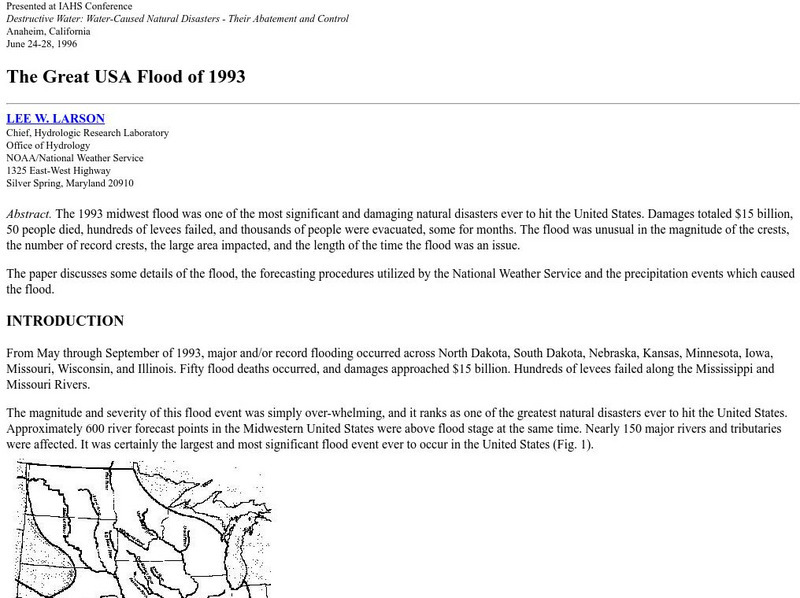
Noaa: The Great Usa Flood of 1993
Interesting abstract about the flood that hit the Midwest in 1993, one of the worst floods in United States History. Find out why the flood occurred, the damage, maps of the damage, charts, graphs, and statistics.
Robert Schenk, PhD
Cyber Economics: Supply and Demand Overview
This is a site from the St. Joseph's College with an overview of the supply and demand model. It is actually the first page of a lesson on supply and demand complete with links to more in-depth discussions including graphs and charts...
Simon Fraser University
Chem1 Virtual Textbook: The Ideal Gas Equation of State
The General Chemistry Virtual Textbook, or Chem 1, is broken into several sections covering various aspects of topics related to chemistry. This section deals specifically with the ideal gas law. To help with the topic, formulas, charts,...
Council for Economic Education
Econ Ed Link: Focus on Economic Data: The Inflation Rate
Explore the inflation rate from 2013 through this informative case study. Trace the consumer trends through the graphs and charts on the site.
Other popular searches
- Pie Charts and Graphs
- Reading Charts and Graphs
- Behavior Charts and Graphs
- Charts and Graphs Candy
- Interpret Charts and Graphs
- Charts and Graphs Christmas
- Charts and Graphs Math
- Analyzing Charts and Graphs
- Tables, Charts and Graphs
- Charts and Graphs Europe
- Using Charts and Graphs
- Bar Graphs and Charts


![Inside Mathematics: Parking Cars [Pdf] Lesson Plan Inside Mathematics: Parking Cars [Pdf] Lesson Plan](https://d15y2dacu3jp90.cloudfront.net/images/attachment_defaults/resource/large/FPO-knovation.png)


