Center Science Education
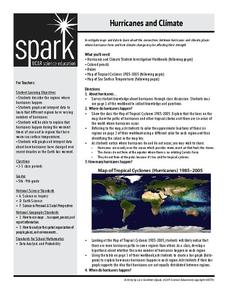
Hurricanes and Climate
Feeling under the weather? This lesson on hurricanes can whip things up! With professionally designed maps and handouts, teach your future weathermen (or women) where, when, and how hurricanes occur. They identify hurricane regions and...
Wild BC
Is Climate Change Good for Us?
Is it really that big of a deal if the global climate undergoes a little change? Young environmentalists consider this very question as they discuss in small groups the impact of different climate change scenarios on their lives,...
Mixing In Math
Mixing in Math: Growing Plants
Whether you have your class plant seeds or begin when sprouts are visible, math skills are used here to predict and track growth over time. Straw bar graphs show plant height on a given day while the graph as a whole shows changes over...
It's About Time
Taking a Ride on a Lithospheric Plate
Assist your pupils and broaden their horizons with several activities that determine the exact positioning of various communities over the globe. Pupils use data from the Global Positioning System to determine the position and rate of...
US Environmental Protection Agency
Weather and Climate: What's the Difference?
Future weather forecasters collect daily temperatures over a period of time. Afterward, they compare their data with monthly averages, as researched on national weather websites, in order to grasp the difference between weather and...
Curated OER
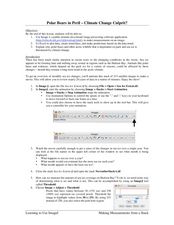
Polar Bears in Peril - Climate Change Culprit?
Learners explore the changes in sea ice over several years. In this life science lesson, students review and examine 20 years of data. They use Excel to graph data and analyze trends.
Curated OER
Introduction to Ozone Reading Activity
Simple, but suitable, this lesson gives mini-meteorologists a glimpse at ozone in the atmosphere. By reading an article, they find that ozone in the stratosphere is vital to life, but ozone in the troposphere is problematic. A reading...
Science Matters
Spaghetti Fault Model
Does increasing the pressure between two moving plates provide a stabilizing force or create more destruction? The hands-on instructional activity encourages exploration of strike-split fault models. The sixth instructional activity...
Curated OER
Paper Production
Students compare paper making by hand and by assembly line. In this manufacturing lesson, students compare and contrast the two main ways to make paper, by hand or by machine. Students research paper making and have a class...
Curated OER
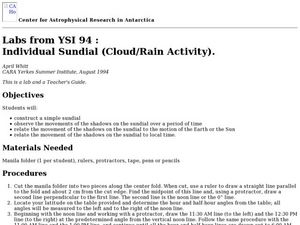
Individual Sundial (Cloud/Rain Activity)
Students make a simple sundial to examine the changes in shadows over time. In this sundial and shadow lesson, students make a simple sundial out of a manila folder and pencil. They observe how shadows change over time, and relate it to...
Curated OER
Cloudy vs. Clear
Students analyze line plots. In this weather lesson using real NASA data, students discuss how weather affects the way the Earth is heated by comparing different line plots.
Curated OER
Earth's Rotation Changes and the Length of the Day
In this Earth's rotation and day length worksheet, students are given a table with the period of geological time, the age of the Earth and the total days per year. Students calculate the number of hours per day in each geological era,...
Curated OER
Don’t Cry Over Spoiled Milk!
Seventh graders explore how milk spoils over time. In this biology lesson, 7th graders discover how pH changes as microorganisms enter the food and multiply. They explain the benefits of pasteurization process.
Curated OER
A Little Horse Sense
How have horses evolved over time? How do horse skulls reveal this evolution? How have the roles horses play changed over time? What kind of social structure do horse herds have? How should wild horse populations be managed? To find the...
Curated OER
Olympic Line Graphs
Sixth graders examine how to make line graphs. In this Olympic line graph lesson plan students make line graphs and search the given Internet sites to find data on their summer Olympic Game.
Cornell University
Constructing and Visualizing Topographic Profiles
Militaries throughout history have used topography information to plan strategies, yet many pupils today don't understand it. Scholars use Legos and a contour gauge to understand how to construct and visualize topographic profiles. This...
K12 Reader
What Glaciers Leave Behind
Glaciers may seem distant and stationary, but they are huge deposits of moving ice that have made changes to the earth's surface. Your pupils can learn about the different types of impressions left by glaciers by reading the short...
Space Awareness
Making A Sundial
Can people really measure time just by using the sun? Scholars venture outside on a nice, sunny day to build sundials and learn how people measured time 600 years ago. The class builds two different sundials while gaining practice with...
Curated OER
PLATE MOVEMENTS AND CLIMATE CHANGE
Students label three geological maps with continents provided to analyze the relationships between the movement of tectonic plates and the changes in the climate. In small groups, they discuss their findings and form hypotheses about the...
Curated OER
A Sweet Drink
Students investigate reaction rates. In this seventh or eighth grade mathematics lesson, students collect, record, and analyze data regarding how the temperature of water affects the dissolving time of a sugar cube. Studetns...
Curated OER
Is Portland, Oregon Experiencing Global Warming?
Students use data to determine if the climate in Portland has changed over the years. In this weather lesson students complete line graphs and study long wave radiation.
Curated OER
How Do Plants Grow?
Young scholars investigate plant growth. In this plant growth lesson, students investigate what would happen to plants if they did not have water and sunlight. Young scholars conduct experiments to determine what plants need. Students...
Curated OER
Earth's Warming Climate: Are We Responsible
Students examine the atmospheric data for CO2. In this web-based atmospheric lesson, student follow instructions to examine and plot on-line scientific data about the CO2 levels in our atmosphere and analyze the changes found in the data.
Curated OER
Mapping Ancient Coastlines
Most of this instructional activity is spent working on the "Bathymetry Worksheet." It includes a graph of the changes in sea level over the past 150,000 years and a bathymetric map of changes in an imaginary coastline over time....


