Curated OER
Are You Full of Hot Air?
Explore the concept of measuring and recording circumference. In this physical science and measurement lesson plan, young learners blow up balloons, measure the circumference, and record the data on an interactive graphing website.
Curated OER
Shoe Showdown
Third graders use rulers to measure their shoe size in inches and centimeters. They then enter the class shoe measurements into an excel data base and graph the results of both to make the comparison.
Curated OER
Digger and the Gang
Help online friends Digger and Sprat from the BBC series to solve math problems! In a series of activities, your class will use data sets to calculate measurements, averages, means, and probabilities. The class completes worksheets and...
Curated OER
Hand Span and Height
Is there a relationship between hand span width and height? Statisticians survey each other by taking measurements of both. A table that can hold data for 24 individuals is printed onto the worksheet, along with questions for analysis....
Curated OER
Unit 4: Worksheet 4: Functions and Graphs
In this function and graph worksheet, students read and interpret maps and graphs. They write an equation, define variables and solve the equation. Students solve diamond problems and use the distributive property to solve equations. ...
Houghton Mifflin Harcourt
Unit 3 Math Vocabulary Cards (Grade 5)
Fifty-four flashcards make up a set to help reinforce math vocabulary. The set offers two types of cards; a word card printed in bold font, and a definition card equipped with an example and labels. Terms include capacity, histogram,...
Royal Baloo
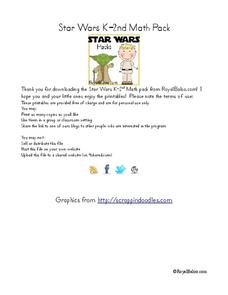
Star Wars K-2nd Math Pack
Included in a Star Wars themed packet, young padawans enhance mathematical skills such as graphing, computing using basic operations, counting numbers and money, telling time, and measuring. Scholars play a game of sudoku, read number...
Curated OER
Environmental Graphing
Students experiment with graphing. For this graphing introduction lesson, students complete four activities: 1) a bar graph based on class birthdays 2) an estimation graph of the raisins in raisin bread 3) another estimation example with...
Virginia Department of Education
Curve of Best Fit
Which function models the data best? Pupils work through several activities to model data with a variety of functions. Individuals begin by reviewing the shapes of the functions and finding functions that will fit plotted data points. By...
Virginia Department of Education
Linear Curve of Best Fit
Is foot length to forearm length a linear association? The class collects data of fellow scholars' foot length and the length of their forearms. They plot the data and find a line of best fit. Using that line, they make predictions of...
Curated OER
Fourth Grade Mathematics Quiz
For this math worksheet, 4th graders complete multiple choice questions about multiplication, bar graphs, rounding, and more. Students complete 15 questions.
Curated OER
Wrapped Up In A Kiss!
Students use the wrapper of a Hershey's Kiss to practice estimating, predicting and measuring. They measure with centimeter rulers.
Curated OER
Button Bonanza
Collections of data represented in stem and leaf plots are organized by young statisticians as they embark some math engaging activities.
Mixing In Math
Mixing in Math: Growing Plants
Whether you have your class plant seeds or begin when sprouts are visible, math skills are used here to predict and track growth over time. Straw bar graphs show plant height on a given day while the graph as a whole shows changes over...
Curated OER
How Does Your Plant Grow?
Pupils measure and record their height in centimeters on a graph. By integrating math and science, students collect data and apply graphing skills to the experiences they are having growing plants. Finally, pupils identify how to...
Curated OER
Cubed Containers
Learners explore volume in relation to centimeter cubes and other nonstandard units of measurement using small containers. They will use hands-on materials to practice this concept. You will need small objects and containers to set this up.
Curated OER
Measurement and Algebraic Thinking
Comparatively speaking, does a bug travel farther than a human in 10 seconds? Get a bug and measure how far it travels in 10 seconds. Have a human team member run for 10 seconds and calculate the distance ran. Answer the question,"Who...
Curated OER
Bubble Mania
Elementary schoolers practice measuring a soap bubble print. They follow a recipe to make a soap bubble solution. Pupils use the soapy solution to blow large bubbles with a plastic drinking straw until they pop leaving behind a circular...
Georgia Department of Education
Math Class
Young analysts use real (provided) data from a class's test scores to practice using statistical tools. Not only do learners calculate measures of center and spread (including mean, median, deviation, and IQ range), but also use this...
Curated OER
Growing Up With A Mission
Student measure heights and graph them using growth charts for which they find the mean, mode, and median of the data set. They graph points on a Cartesian coordinate system.
Curated OER
Making Estimations in Measurement
Students utilize their knowledge of measurement in making accurate measurements and estimations.
Curated OER
Make a Dinosaur
Students estimate the size of dinosaurs and create a dinosaur model. They create bar graphs of the sizes of dinosaurs one in meters and the other in "student" units. They draw a pictures and add words or sentences about their dinosaur.
Curated OER
Solving Inequalities Self-Test
In this inequalities worksheet, students answer 6 multiple choice problems. Students then solve and graph 13 inequalities. Students answer 1 open-ended word problem.
Curated OER
Inch by Inch and Centimeter by Centimeter Extravaganza
Students use both standard and metric measurement. They compare and contrast standard to non-standard units of measurement.


