US Department of Commerce
Featured Activity: Exploring Questions for the 2020 Census
Just what is the census for? Using data and census questions, class members explore how officials gather information. Then, they consider how the government uses the answers to determine how it spends its money with a collaborative...
US Department of Commerce
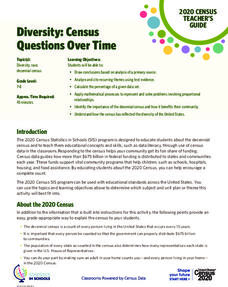
Diversity: Census Questions Over Time
The story of race in the United States continues to evolve, and the numbers show it. Using data from the last two census counts, learners consider recent demographic shifts. They then analyze the information to hypothesize: What could...
Curated OER
What's in a Number? Analyzing Smoking Statistics
Sixth and seventh graders analyze smoking statistics. In this health lesson plan, learners look at the percentage of people who smoke from each race group. They create a bar graph and circle graph that displays this information.
American Statistical Association
Scatter It! (Using Census Results to Help Predict Melissa’s Height)
Pupils use the provided census data to guess the future height of a child. They organize and plot the data, solve for the line of best fit, and determine the likely height and range for a specific age.
Curated OER
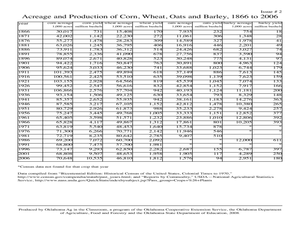
George Washington and the First Census of Agriculture
Sixth graders compare modern agricultural statistics with those that are extracted from a primary source letter of George Washington. They complete worksheets and discuss what they have learned.
Curated OER
Aboriginal Statistics
Fourth graders analyze statistics of Native Americans by creating graphs. In this data analysis lesson, 4th graders define different statistical terms and practice finding those statistics from groups of numerical information about...
Curated OER
The Demographics of Immigration: Using United States Census Data
High schoolers work together to analyze United States Census data on immigration. They compare and contrast the data and determine how immigration numbers have changed over time. They calculate percentages and make their own...
US Department of Commerce
Where to Next?
Salary, education, census statistics ... how do people choose their careers? Scholars complete worksheets and rely on census data to determine their career aspirations. Then, pupils conduct Internet research about places they would...
Curated OER
The Census
Students analyze why the census is important and the benefits of it. Determine rights and responsibilities in real life situations. They are divided into groups and take a mock census of a list of teachers and students each. Results of...
Curated OER
Census Statistics
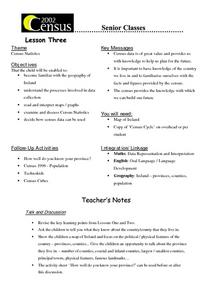
Twelfth graders become familiar with the geography of Ireland. They explore the processes involved in data collection. Students examine and discuss Census Statistics and read and interpret maps/graphs. They decide how the census data can...
Curated OER
It's Census Time: Census Lesson Plans
Census lesson plans can provide an interdisciplinary look at how the data is used, and what it means for everyone.
US Department of Commerce
Census in Counties - Describing and Comparing Histograms to Understand American Life
Use graphs to interpret life in 136 counties. Pupils analyze histograms and describe the shapes of the distributions of data collected from several counties on different aspects of life. Scholars make predictions on the difference in...
Curated OER
Student Census
Students collect data from their peers and store the information in a database. As students manage the information they realize the usefulness of a database as a tool to manage large amounts of information in an efficient and accurate...
US Department of Commerce
Make Data Speak
Data displays are more than just a bunch of numbers. Small groups access census results and create eye-catching data displays. Teams choose a statistic and collect data points for five locations. Classmates present their infographics to...
Curated OER
Statistics Canada
Young scholars practice using graphing tools to make tables, bar charts, scatter graphs, and histograms, using census data. They apply the concept of measures of central tendency, examine the effects of outliers. They also write...
Curated OER
Makiing Sense of the Census
Students investigate trends in agriculture. In this secondary mathematics lesson plan, students evaluate agricultural census data from 1982 to 2202 as they compare the properties of the mean and the median. Students explore what sorts...
Curated OER
Census Sensibility
Students examine the importance of the census and census data collection methods. They gather statistical data, create graphs comparing state and national populations, and compose written reflections on why the census is necessary.
Curated OER
Census Statistics and Graphing
Learners graphically represent data from the Census. In this middle school mathematics lesson plan, students investigate the housing characteristics of different tribes of Native Americans and compare them to the average American...
Curated OER
Being an Educated Consumer of Statistics
Students examine kinds of data used to report statistics, and create their own statistical report based on any of the four sources of media information (Internet, newspaper, TV, magazine).
Curated OER
An Introduction to Elementary Statistics
Students explain and appreciate the use of statistics in everyday life. They define basic terms used in statistics and compute simple measures of central tendency.
Curated OER
A look at our larger population
Student team together to tell the story of the U.S.'s rapid population growth. High schoolers research census changes, focusing on changes in the size of the community and the school. Students tell the story by writing articles and...
Newseum
News About My Community
After researching statistics about their community in local census reports, young journalists interview a resident about their interests and then analyze a local newspaper or homepage to see how similar the stories are to the residents'...
Curated OER
Create Your Own Form
Students gather and organize data using a mock census form, and determine mean, mode, range, and median for sets of data.
Curated OER
Making Sense of the Census
Students problem solve the mean and median of agricultural data by completing a worksheet. They discuss the results of the statistical data.


