David Pleacher
Candy Math Fun
Few things can motivate children to learn like the promise of a sweet and tasty treat. Given a bag of M&M®s, Skittles®, or other colorful candy, students first predict the contents of the bag before counting the pieces,...
Virginia Department of Education
Graphing Linear Equations
Combine linear equations and a little creativity to produce a work of art. Math scholars create a design as they graph a list of linear equations. Their project results in a stained glass window pattern that they color.
Yummy Math
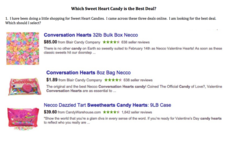
Which Sweet Heart Candy Is the Best Deal?
Get the most Valentine's candy for your money with a fun math activity! After examining three deals for buying candy hearts in bulk, young mathematicians decide which deal is the best and use bar graphs to demonstrate their claim. They...
Yummy Math
US Holiday Candy Sales
Candy is a big business! Calculate the amount of money consumers spent on major holidays—Easter, Halloween, Christmas, Hanukkah, and Valentine's Day—based on the total amount of candy sales from 2011 and the percentage of each holiday's...
Curated OER
Tim and Pat at the Store: Bar Graphs
Do you like candy? Tim and Pat go to the candy store every day after school. Can you use the chart to determine how much money they spend each day? Does one spend more than the other?
Curated OER
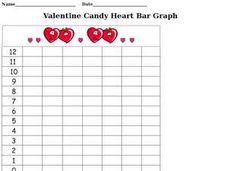
Valentine Candy Heart Bar Graph
In this Valentine candy heart bar graph worksheet, students complete a bar graph illustrating how many different colored candy hearts they received for Valentine's Day.
Curated OER
Grab the Candy Hearts
For this candy activity, learners play the game Grab the Candy for Valentine's Day where they roll dice to find ordered pairs on a graph and place the candy inside that square. Learners play until all candy is gone and use the scoring...
Curated OER
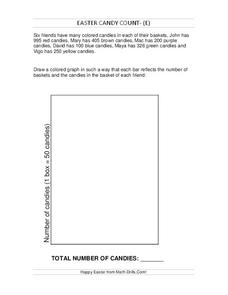
Easter Candy Count
In this bar graph worksheet, students fill in the bar graph based on the information about Easter candy that each child got. Students complete 6 spaces in the bar graph and find the total number of candies.
Curated OER
Easter Candy Count
In this bar graph worksheet, students complete a bar graph based on the information of Easter candy they are given for each color. Students complete 6 spaces in the bar graph and find the total.
Curated OER
Easter Candy Count
In this bar graph learning exercise, students fill in the bar graph with the information of Easter candy that each child has and find the total. Students fill in 6 bars in the bar graph.
Curated OER
Easter Candy Count
In this bar graph learning exercise, learners complete a bar graph based on the information of Easter candy they are given for each color. Students complete 6 spaces in the bar graph and find the total.
Curated OER
Easter Candy Count
In this bar graph learning exercise, students complete a bar graph based on the information of Easter candy they are given for each color. Students complete 6 spaces in the bar graph and find the total.
Curated OER
M&M's Candies Worksheet Graph
In this graphing worksheet students will record data on a bar graph. Students will take a bag of M&M's and chart the colors they find inside this bag.
Curated OER
Easter Bar Graph - (B)
In this math review worksheet, students complete addition, subtraction, multiplication, and division problems and put their answers into a bar graph that represents calories. Students complete 13 problems and 1 graph.
Curated OER
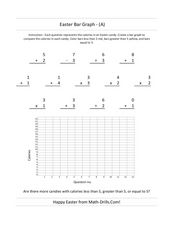
Easter Bar Graph- A
In this Easter math worksheet, students first solve 13 problems with addition, subtraction, multiplication and division. Using the answers, students make a bar graph.
Curated OER
Easter Bar Graph - C
In this math review learning exercise, students complete addition, multiplication, division, and subtraction problems where each answer is inserted into a bar graph. Students complete 13 problems.
Curated OER
Easter Bar Graph - (E)
In this math review worksheet, students complete addition, multiplication, division, and subtraction problems where each answer is put into an Easter bar graph. Students complete 13 problems.
Curated OER
Easter Bar Graph - (D)
In this math review worksheet, students complete addition, multiplication, division, and subtraction problems where each answer is put into an Easter bar graph. Students complete 13 problems.
Curated OER
Math, Sweet Math Activity Sheet
In this candy graphing learning exercise, 1st graders will place candy on their paper to create a bar graph. They will answer several questions based on their data. A teacher checklist is provided.
Curated OER
M & M's Candy Color Chart
In this graphing learning exercise, students open a package of M & M candies and use this prepared graph to record how many of each color are present.
Charleston School District
Review Unit 4: Linear Functions
It's time to show what they know! An assessment review concludes a five-part series about linear functions. It covers all concepts featured throughout the unit, including linear equations, graphs, tables, and problem solving.
Curated OER
Conversation Hearts Graph: Valentine's Day
In this graphing conversation hearts worksheet, learners sort and count the colors of candy hearts, and determine which color had the most and least numbers. Students answer eight questions.
Curated OER
Pumpkin Graph
In this Halloween graphing worksheet, 3rd graders graph the number of candies shown on the page. Students cut out and decorate their pumpkin after graphing the 3 types of candy.
Curated OER
"M&M's"® Candies Worksheet 2
In this math worksheet, students plot the mean, median, and mode for the colors of M and M candies by filling in the graphic organizer.
Other popular searches
- Charts and Graphs Candy
- Halloween Candy Graphing
- Graphing Candy
- Graphing Data With Candy
- Graphing Candy Corn
- Rock Candy Bar Graph
- Graphing Candy Hearts
- Graph With Candy
- M&m Candy Graph
- Excel Candy Graph
- Math Graphing Candy Canes
- Cereal or Candy Graph


