Curated OER
Thirsty Rocks: Please "Porous" a Drink!
A simple activity goes a long way in demonstrating the property of porosity to your rock hounds. They will mass a specimen of dry sandstone and then soak it in a pre-measured amount of water. After seven minutes, they once again measure...
It's About Time
The Mu of the Shoe
What is mu? Emerging scientists explore the coefficient of sliding friction, or mu, and apply its concepts as they complete activities in the interesting lesson. They measure the sliding friction between soles of their own athletic shoes...
Charleston School District
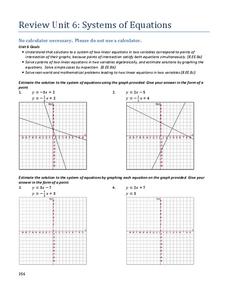
Review Unit 6: Systems of Equations
It's time to show off what they learned! The final lesson in the series is a review worksheet on the topics learned throughout the unit. Scholars solve systems of equations using graphic and algebraic methods, solve system-based word...
Teach Engineering
Creepy Silly Putty
It might be silly to determine the creep rate of putty but groups will enjoy making different formulations of silly putty and playing with them to understand how the different mixtures behave. The second part of the activity has groups...
Virginia Department of Education
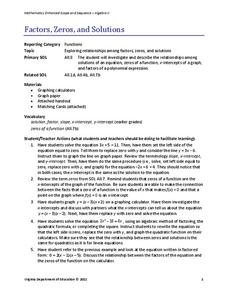
Factors, Zeros, and Solutions
Factors, zeros, and solutions, oh my! Don't let your classes become overwhelmed with the vocabulary. An engaging instructional activity helps learners make a connection between factors, zeros, and solutions. Pupils explore the...
EngageNY
End-of-Module Assessment Task: Grade 8 Mathematics (Module 7)
It's time to discover what your classes have learned! The final lesson in the 25-part module is an assessment that covers the Pythagorean Theorem. Application of the theorem includes distance between points, the volume of...
101 Questions
Bottomless Mug
How much coffee can you actually drink? An intriguing lesson has learners consider an advertisement for a bottomless mug of coffee. While considering the price of the mug, they analyze different scenarios to determine the cost-saving...
Texas Instruments
Finding Linear Models Part III
Explore linear functions! In this Algebra I lesson, mathematicians graph data in a scatter plot and use a graphing calculator to find a linear regression and/or a median-median line. They use the model to make predictions.
American Statistical Association
How Long is 30 Seconds?
Is time on your side? Pupils come up with an experiment to test whether their classmates can guess how long it takes for 30 seconds to elapse. They divide the class data into two groups, create box-and-whisker plots, and analyze the...
Illustrative Mathematics
Shirt Sale
Everyone loves a good deal, and your mathematician's job is to calculate the original price when given the discount. A different type of problem than the traditional "find the percent change" has your learners working backwards to...
Kenan Fellows
Isotopic Pennies
Many people confuse atomic mass and atomic numbers. The sixth of seven lessons in a unit requires scholars to find the weight of different groups of pennies. Then, they must solve how many of each type of penny exists in a closed system...
Curated OER
Long Day?
Students become aware of the effects of tides on the Earth's rotation. In this tides lesson plan, students calculate the number of seconds lost over various periods of time.
Curated OER
A Comparison Study of Water Vapor Data to Precipitation over North America
Students use NASA satellite data to compare water vapor over the United States. In this data analysis lesson students use an Excel spreadsheet to map their data.
Curated OER
Antarctic Exploration
In December of 2011, the New York Times released an article describing new investigations of old Antarctic explorations. Your class will read the article then answer 12 related comprehension questions.
Curated OER
Questioning NASA
Space science and math collide in this inquiry that investigates launching times for antacid-tablet rockets! Upper elementary or middle school learners collect data as they launch these mini rockets. They apply concepts of place value...
Curated OER
A More Perfect Union: The Story of Our Constitution
Sit back, relax, and transport to 1787! This lesson on the Constitution begins with guided imagery of the Constitutional Convention. The class reads A More Perfect Union: The Story of Our Constitution in an...
SaveandInvest.org
The True Cost of Owning a Car
Almost every teen wants a car, but can they really afford one? The lesson walks pupils through how to identify a budget, find all of the costs associated with car ownership, and determine if they should buy the car or keep looking.
Statistics Education Web
Which Hand Rules?
Reaction rates vary between your dominant and nondominant hand ... or do they? Young scholars conduct an experiment collecting data to answer just that. After collecting data, they calculate the p-value to determine if the difference is...
Utah Education Network (UEN)
The Pasture and the Fence
Beginning geometers use tiles and grid paper to draw and calculate perimeter and area. Rectangles of different sizes are created and then measured to build understanding. The one-inch grid sheet referenced is attached.
Curated OER
Balloon Math: A Game for All Levels
Here is a game that combines exercise with math skills. In this mathematics and P.E. instructional activity, students hold balloons that have a number written on them, and for a set time do not let the balloons hit the ground. They must...
Curated OER
Now That's Using Your Head!
Explore linear measurement. Scholars will measure the circumference of their head and the distance they can jump. Information is recorded, averages are calculated, and a data table is completed. They then determine possible relationships...
Curated OER
The World of Work
Students identify between appropriate and inappropriate behaviors at work. In this work behaviors instructional activity, students use a dictionary to define the related terms and visit various links to complete activities that define...
Curated OER
Solving Multi-Step Inequalities
Ready to study inequalities with your class? Use this worksheet to solve multi-step inequalities and graph the solutions. The document would be great to use as a study guide as you present the material, or could easily be modified and...
Chymist
Pressure-Volume Relationships: Experiments with 140-mL Syringe
Learners examine Boyle's Law by analyzing experimental results with a hands-on lesson that provides a set of four experiments that illustrate the relationship between pressure and volume of gases. Groups analyze results using...


