Curated OER
Slope of Parallel and Perpendicular Lines
For this parallel and perpendicular lines worksheet, students determine the slope of a line. They calculate the slope of a line parallel and perpendicular to a given line. This two-page worksheet contains 22 problems. Answers are...
Curated OER
Slope
Students graph lines and identify the slope. In this algebra lesson plan, students graph a line using y=mx+b and graph lines that are horizontal or vertical. They calculate the slope of the line using two points, and identify lines by...
Curated OER
Lines, Lines, Everywhere
Students explore linear equation suing real life scenarios. In this algebra lesson plan, students find the slope and intercept of a line. They create table of values to plot their graph and draw conclusions.
Curated OER
Exploring Linear Equations: Student Worksheet
An activity around linear equations, slope, and intercept is here for you. In it, young mathematicians engage in a whole-class activity while the teacher uses the overhead projector graphing calculator. This activity also focuses on...
Curated OER
Density of a Paper Clip Lab Review
Even though this assignment is brought to you by Physics Lab Online, it is best used as a math practice. Middle schoolers calculate the range, mean, mode, and median for a list of eight different paper clip densities. They analyze...
Curated OER
Slope & Rate of Change
This short handout addresses the concept of slope in two different ways: geometrically and analytically. Start with a brief description of slope, then use graphical representations to compare positive vs. negative slope and zero vs....
Curated OER
A Sweet Drink
Young scholars investigate reaction rates. In this seventh or eighth grade mathematics instructional activity, students collect, record, and analyze data regarding how the temperature of water affects the dissolving time of a sugar...
Curated OER
Gradients of Parallel Line Segments
In this gradient worksheet, students draw line segments and determine if they are parallel. They plot points on a coordinate plane and calculate the gradient of each created line. This five-page worksheet contains 8 multi-step problems....
BW Walch
Creating and Graphing Linear Equations in Two Variables
This detailed presentation starts with a review of using key components to graph a line. It then quickly moves into new territory of taking these important parts and teasing them out of a word problem. Special care is taken to discuss...
Radford University
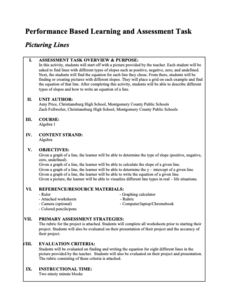
Picturing Lines
Slopes are everywhere—even in houses! Given a picture of a house, learners find lines with positive, negative, zero, and no slopes. Scholars determine the equation of the lines by calculating the slopes and y-intercepts. Class members...
PHET
Graphing Lines
Ready to increase pupils' understanding of slope with an upward slope? Scholars use an interactive that allows users to move two points on a coordinate plane. The interactive then automatically calculates the slope, the slope-intercept...
EngageNY
Graphs of Linear Functions and Rate of Change
Discover an important property of linear functions. Learners use the slope formula to calculate the rates of change of linear functions. They find that linear functions have constant rates of change and use this property to determine if...
Radford University
Ramp It Up
Pupils gather measurements of real-world objects that have slopes. They then plot the measurements and find an equation of a line that fits the measurements. Finally, groups investigate the ADA and determine whether different ramps meet...
Flipped Math
Correlation
Determine how close the line is to the scatter plot. Clear video instruction shows how to plot a scatter plot and find the best fit line using the linear regression function on a calculator. Pupils use the information from the calculator...
Benjamin Franklin High School
Saxon Math: Algebra 2 (Section 4)
This fourth of twelve units in a series continues the investigation of functions through equations and inequalities. However, the modular nature of the lessons in the section make this an excellent resource for any curriculum covering...
National Council of Teachers of Mathematics
Stitching Quilts into Coordinate Geometry
Who knew quilting would be so mathematical? Introduce linear equations and graphing while working with the lines of pre-designed quilts. Use the parts of the design to calculate the slope of the linear segments. The project comes with...
Curated OER
Race The Rapper: Slopes
Students calculate the slope of the equation In this algebra lesson, students graph coordinate pairs of linear equations and identify the relationship between x and y values and slope. They differentiate between functions and relations....
Curated OER
A Steep Hike
Students explore slope. In this middle school mathematics lesson, students analyze and interpret graphs as they investigate slope as a rate of change. Students use a motion detector to collect data as they walk at different speeds and...
Curated OER
Race the Track! Super Slope (Lesson One)
Fifth graders utilize basic physics concepts to calculate speed of an object set in motion from various heights. In this basic physics lesson plan, 5th graders make observations, calculations, record data, and conclusions throughout...
Curated OER
The Slope of Land in Your Community
Students participate in finding the slope of a sand pile and then other materials. In this geology lesson, students describe what happens to the piles of materials when they are poured through a funnel. Students measure the slope using a...
Curated OER
Analyzing Equations Through Slope and Y intercepts
Students analyze equations using the slopes and intercept. In this algebra instructional activity, students graph equations give the slope and y intercepts. They are also asked to identify the slope and y intercept from a given graph....
Curated OER
Analyzing Equations Through Slope and Y intercept
Students analyze equations using the slope and y-intercept. In this algebra lesson, students identify the slope using a and the intercept using m. They graph linear equations based on the slope and intercept.
Curated OER
Influence and Outliers
Using the TI-Nspire calculator, statisicians identify outliers and their effect on the least-squares regression line. In finding the line of best fit, they determine what points will affect the least squares regressions and what points...
Curated OER
What's Its Slope
Young scholars identify the slope of a lines.For this algebra lesson, students define the meaning of slope and write an equation given the slope. They graph linear functions using the slope and y-intercept.


