Region of Peel
Put Me in Order
Sorting fractions, integers, decimals and square roots into sequential order is an active process when you use a gym as your setting. After your class is divided into two groups and provided with number cards, they compete to see who can...
Illustrative Mathematics
Sports Equipment Set
Many students like to play sports and the equipment that goes with it costs money. The resource sets up an inequality that gives a total amount needed to purchase the equipment and the initial amount of money already obtained. In order...
Illustrative Mathematics
3-D Shape Sort
From the apple on your desk and the coffee cup in your hand, to the cabinets along the classroom wall, basic three-dimensional shapes are found everywhere in the world around us. Introduce young mathematicians to the these common figures...
Willow Tree
Circle Graphs
Pie isn't just for eating! Scholars learn to create pie charts and circle graphs to represent data. Given raw data, learners determine the percent of the whole for each category and then figure out the degree of the circle that percent...
EngageNY
Introduction to Simultaneous Equations
Create an understanding of solving problems that require more than one equation. The lesson introduces the concept of systems of linear equations by using a familiar situation of constant rate problems. Pupils compare the graphs of...
EngageNY
Conducting a Simulation to Estimate the Probability of an Event II
Add some randomization into simulations. The 11th installment in a series of 25 presents two new methods to use in simulations--colored disks, and random numbers. Pupils use random numbers to run simulations where the probabilities make...
Virginia Department of Education
z-Scores
Just how far away from the mean is the data point? Pupils calculate the standard deviation for a set of data and find out how many standard deviations a point is away from the mean. The teacher leads a discussion on how to calculate...
EngageNY
Creating a Histogram
Display data over a larger interval. The fourth segment in a 22-part unit introduces histograms and plotting data within intervals to the class. Pupils create frequency tables with predefined intervals to build histograms. They describe...
Virginia Department of Education
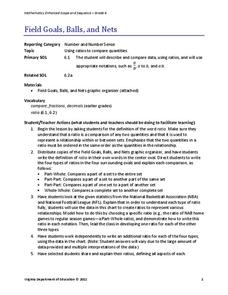
Field Goals, Balls, and Nets
Score a resource on ratios. Young mathematicians learn about different ways to express ratios. Using sports data, they write statements about the statistics in ratio form.
Curated OER
The Distributive Property
Students use a visual to introduce the Distributive Property. The instructional activity is chronologically numbered and follows a distinct plan. The class works with the teacher to complete the instructional activity. The plan is not...
Curated OER
Sorting and Classifying
Fifth graders are engaged in sorting and classifying geometric shapes of various colors and sizes. They discuss the properties of these shapes and illustrate a range of classifications using Venn diagrams.
Curated OER
No Foot, No Horse
Why do horses wear shoes? Why do people wear shoes? Using worksheets, which are embedded in the plan, learners write descriptive paragraphs about their own shoes, classify a pile of shoes, and also engage in math games about the variety...
Curated OER
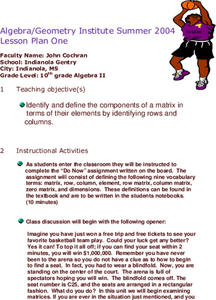
Matrices
Students explore matrices. Given a particular situation, they discover the make-up and design of a matrix. Students identify examples of rectangular arrays used in real world situations. They solve oral problems in class.
Curated OER
Shots, Standings, and Shopping
Rates and ratios can easily be applied to real-world situations. Learners explore a series of websites in order to procure comparable data. They define ratios and rates, view videos, and use the internet to explore how ratios and rates...
Curated OER
Height versus Shoe Size
Pupils find a correlation between a person's height and his/her shoe size. They have access to entering data into lists on a graphing calculator and can complete scatter plots. Students read and interpret a scatter plot and use the...
Curated OER
Frequency Distributions
In this statistics worksheet, students solve 5 frequency problems. In four of the problems, the frequency table is provided and students construct one relative frequency table, one cumulative frequency table, and two cumulative relative...
Curated OER
Real World Equations!
Help your math class "get the picture" in a quadratic equation lesson that integrates digital photography. Individuals take pictures to help them model the shape of an item or situation using algebraic equations. They discover how to...
Curated OER
China's Population Growth
Learners collect data from China's population growth and determine the mean, median, and mode from the data. For this data lesson plan, pupils determine probabilities and use them to make predictions.
Curated OER
Circles 1, 2, 3, 4
Here is a way to help your charges identify circles and spheres. In this shapes geometry and technology lesson, students identify and draw circles and explain the related attributes. They recognize circles and spheres while exploring...
Curated OER
Sports Lesson Plan
Have your class participate in a variety of sports and craft activities using this resource. With sports as the theme, learners work on art projects. Students create soccer ball prints, a three dimensional football, and a sports collage.
Curated OER
Chances Are-Part 1
Students are introduced to the idea of probability by discussing the likelihood of events occurring. Pupils describe events that are certain, impossible, likely, and unlikely to occur. They determine the likelihood of an event occurring...
Curated OER
Area and Perimeter of Polygons
In this geometry worksheet, 10th graders calculate the perimeter and area using the specific formula for that polygon. There are 5 questions with an answer key.
Curated OER
Shapes
Students practice identifying spheres, triangles, and rectangles and the difference between plane shapes and space shapes. They identify shapes in the classroom and complete activity sheets.
Curated OER
Figure This Out
Students measure different parts of the human body. In this measurement lesson, students work in pairs to take measurements of human measurements which include: arm span, height, foot length, and wrist to longest finger. They also...
Other popular searches
- Basketball Lesson Plans
- Basketball Elementary
- Basketball Poem
- Basketball Dribbling Skills
- Basketball Activities
- Basketball Math
- Basketball Dribbling
- Basketball Skills
- Basketball Poetry
- Basketball Techniques
- Basketball Multiplication
- Grade Basketball


