Curated OER
What's Missing?
Students practice solving very basic number sentences and recording their answers on a worksheet. Individually, they use different manipulatives to represent the sentence they solved. They also explain what steps were taken to solve...
EngageNY
Equivalent Rational Expressions
Rational expressions are just fancy fractions! Pupils apply fractions concepts to rational expressions. They find equivalent expressions by simplifying rational expressions using factoring. They include limits to the domain of the...
EngageNY
The “WhatPower” Function
The Function That Shall Not Be Named? The eighth installment of a 35-part module uses a WhatPower function to introduce scholars to the concept of a logarithmic function without actually naming the function. Once pupils are...
Curated OER
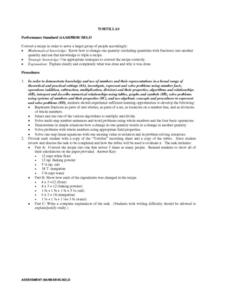
Tortillas
Students convert recipes for tortillas. They calculate the amounts of ingredients as they convert recipes and write an explanation of the task to demonstrate their calculations. After reviewing their calculations, they demonstrate how...
Curated OER
Water Quality Data Analysis
Students develop a process for analyzing collected bayou data.
They find the mathematical relationships among various biological factors.
Students, work collaboratively using technology in their data analysis.
Curated OER
The Way to Better Grades!
Pupils collect and analyze data. In this statistics lesson, learners create a scatter plot from their collected data. They use, tables and graphs to analyze the data and mae decisions.
Curated OER
Cups and Cubes
Third graders explore the use of cups and counters as a model to analyze the effects of operations. They create and use a rule to create a sequential pattern and use cups and cubes to model the relationship.
American Library Association
Even and Odd Numbers: Lesson Plans and Sample Problems
If your youngsters are new to numbers, here are several interactive strategies to get them thinking about even and odd numbers. For example, they can count the number of desks, people, etc. in the room and determine if it is even or odd....
Curated OER
The Pythagorean Theorem Lesson 2
Learners discuss and review examples of the Pythagorean Theorem using a GSP, Geometer's Sketchpad, activity.
Curated OER
Means of Growth
High schoolers collect and graph data. In this statistics instructional activity, students analyze their plotted data using a scatter plot. They identify lines as having positive, negative or no correlation.
Curated OER
How Much Is Too Much?
Students examine population growth and collect data. In this statistics lesson, students create a scatter plot to represent the different species found in the water and are being harvested. They graph their data and draw conclusion from it.
Curated OER
Starting With Stats
Statisticians analyze a data set of student IQs by finding measures of central tendency and dispersion such as mean, median, mode, and quartiles. They practice using a graphing calculator to find the values and analyze box plots and...
Curated OER
Inquiry Unit: Modeling Maximums and Minimums
Young mathematicians explore the maximun area for patio with the added complexity of finding the mimimum cost for construction. First, they maximize the area of a yard given a limited amount of fence and plot width v. area on a...
University of Colorado
Distance = Rate x Time
Every year, the moon moves 3.8 cm farther from Earth. In the 11th part of 22, classes use the distance formula. They determine the distance to the moon based upon given data and then graph Galileo spacecraft data to determine its movement.
Virginia Department of Education
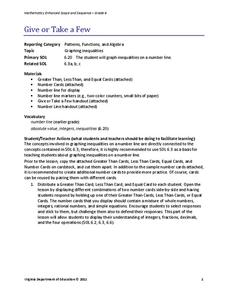
Give or Take a Few
Young mathematicians extend their knowledge of rational numbers on a number line to graph inequalities by first using number cards to compare rational numbers. They finish by using similar reasoning to graph inequalities on a number line.
Curated OER
Impossible Graphs
Young scholars practice plotting functions on the Cartesian coordinate plane while participating in a discussion about the Possible Or Not worksheet/activity. Students also use the Impossible Graphs worksheet to practice reading a graph,...
Curated OER
Linear Piecewise Functions
Students explore the concept of piecewise functions. In this piecewise functions lesson, students graph piecewise functions by hand and find the domain and range. Students make tables of values given a piecewise function. Students write...
Curated OER
Inductive and Deductive Reasoning
Students use logical arguments and inductive reasoning to make or disprove conjectures. After observing a teacher led demonstration, students discover that the deductive process narrows facts to a few possible conclusions. In groups,...
Curated OER
Who is on that Bill? Alexander Hamilton and the Federalist Papers
Students, who are adult learners, participate in an Internet scavenger hunt in order to assimilate information about the biography of Alexander Hamilton and the Federalist Papers. They look at the Federalist and Anti-Federalist Papers...
Curated OER
Interactivate - Lines, Rays, Line Segments, and Planes
Students explore lines, rays, line segments, and planes. In this math instructional activity, students discuss the math concepts and direct their instructor in graphing functions. Students collaborate in graphing additional functions.
Curated OER
How Simple Is Your Rational Expression?
Investigate simplifying rational expressions. Learners define rational expressions, review how numerators and denominators are polynomials and complete several problems using a checklist to ensure they don't skip any steps. Work can be...
Curated OER
Box Plots
Young statisticians are introduced to box plots and quartiles. They use an activity and discussion with supplemental exercises to help them explore how data can be graphically represented.
Curated OER
Uncorking Work Problems
Explore the concept of work with your class, using bottles, water, and corks to calculate work, while using the formula work = rate x time. Students conduct multiple experiments, timing how long it takes for water to drain out of the...
Curated OER
The Method of U-Substitution
In this calculus worksheet, learners solve problems using U-Substitution. They find antiderivatives using indefinite integrals. There are 18 questions with an answer key.


