Hi, what do you want to do?
Curated OER
Telling Time to 5 Minutes
Students take part in various activities ranging from creating a human clock, to small group problem solving to reinforce the concept of telling time accurately to five minutes on an analog clock.
Curated OER
Foods and Languages of the World
Students review Mexico's location and language and learn to pronouns 10 new Spanish food words. Students listen as the book, Corn is Maize is read, touching and passing around an ear of Indian corn. Students discuss the contribution of...
Curated OER
"Measurement in Motion"
Ninth graders examine the rate of motion and changes in motion using a ramp and a rolling object. They conduct the demonstration, determine the average speed, and describe how a moving object can have zero acceleration and deceleration.
Curated OER
Probability or Ability?
Students use their non-dominant hand to catch candy which they tossed in the air. They estimate how many they catch in a second round. They record and determine how the probability changed the second time.
Curated OER
Favorite Christmas Carols
Third graders take a survey of friends' and family members' favorite Christmas carols. They illustrate a favorite Christmas carol and have students try to guess the name of the carol based on the picture.
Curated OER
Do You See What I See?
Students observe and describe different objects seen under a microscope and compare the individual perspectives of what was seen.
Curated OER
We Are Having a Party! Part II
Second graders, in groups, participate in a four-station rotation model to solve problems. They use coins and dice for stations one, two, and three.
Curated OER
Dr. Teeth and Dr. Gums To The Rescue
Second graders role play as dentists researching teeth and their care. They create a slide show showing how a character, Bear, can take care of this teeth explaining habitats, diets and teeth.
Curated OER
A Rainbow Under the Sea: How Do Animals Survive in the Ocean?
Second graders, with adult help, create a PowerPoint presentation on a selected ocean animal.
Curated OER
The effects of microgravity
Fourth graders are given a scenario in the lesson that presents a problem that needs to be solved. They conduct research from multiple sources in order to gather information. This is used to contribute to possible solutions proposed by...
Curated OER
Mother May I?
Third graders measure distance using nonstandard units of measure. In this measurement lesson, 3rd graders measure a given distance through the use of the game "Mother May I?" Student gather and compare data on how many "giant steps" and...
Curated OER
On the Road Again": Moving People, Products, and Ideas
In this lesson students learn how to identify modes of transportation and communication for moving people, products, and ideas from place to place. Students also study the advantages and disadvantages of different modes of...
Khan Academy
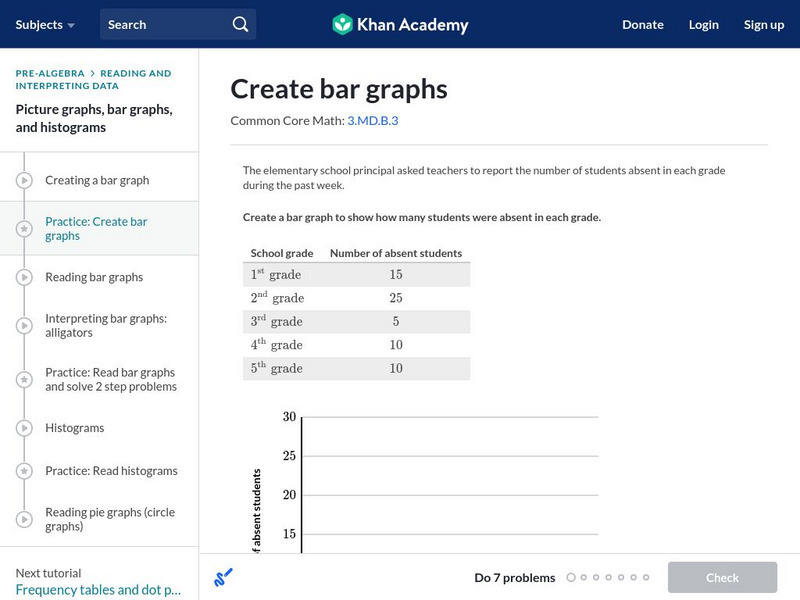
Khan Academy: Create Bar Graphs
Create a bar graph with the data given. Students receive immediate feedback and have the opportunity to try questions repeatedly, watch a video tutorial, or receive hints about creating bar graphs. CCSS.Math.Content.3.MD.B.3 Draw a...
Khan Academy
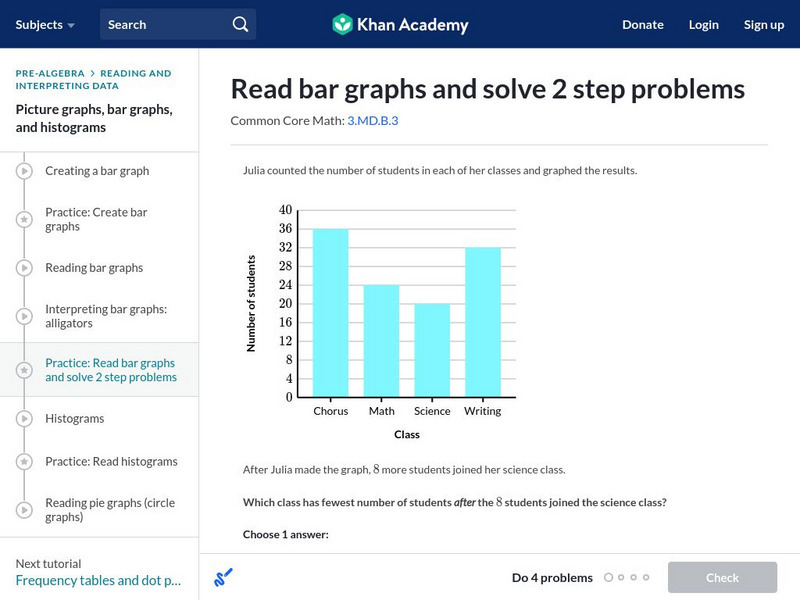
Khan Academy: Read Bar Graphs and Solve 2 Step Problems
Read and interpret a double bar graphs. Students receive immediate feedback and have the opportunity to try questions repeatedly, watch a video or receive hints. CCSS.Math.Content.3.MD.B.3 Draw a scaled picture graph and a scaled bar...
Primary Resources
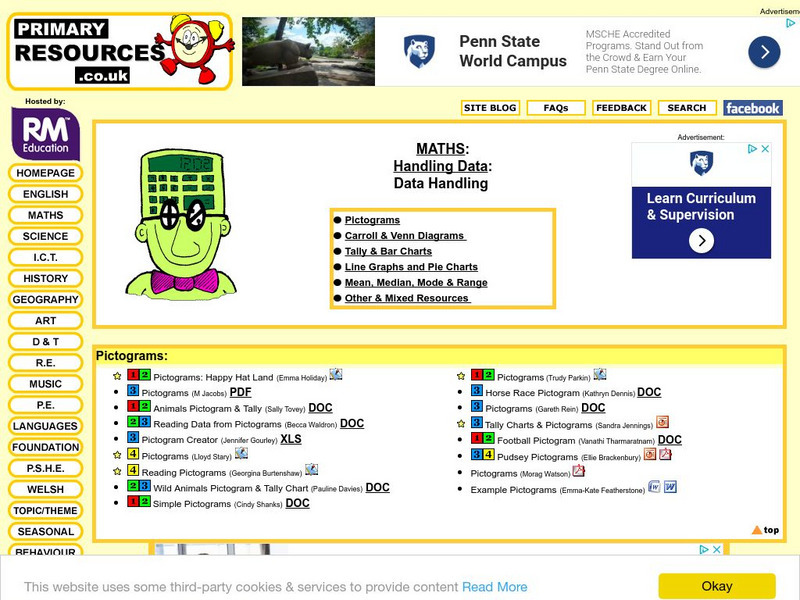
Primary Resources: Tally and Bar Charts
Lots of good materials for teaching about tally marks and bar graphs.
Education Place
Houghton Mifflin: Eduplace: Make a Living Bar Graph
Student use simple data to line up in a living bar graph activity when they respond to simple questions in this lesson plan. They physically and visually represent the data. CCSS.Math.Content.3.MD.B.3 Draw a scaled picture graph and a...
Khan Academy
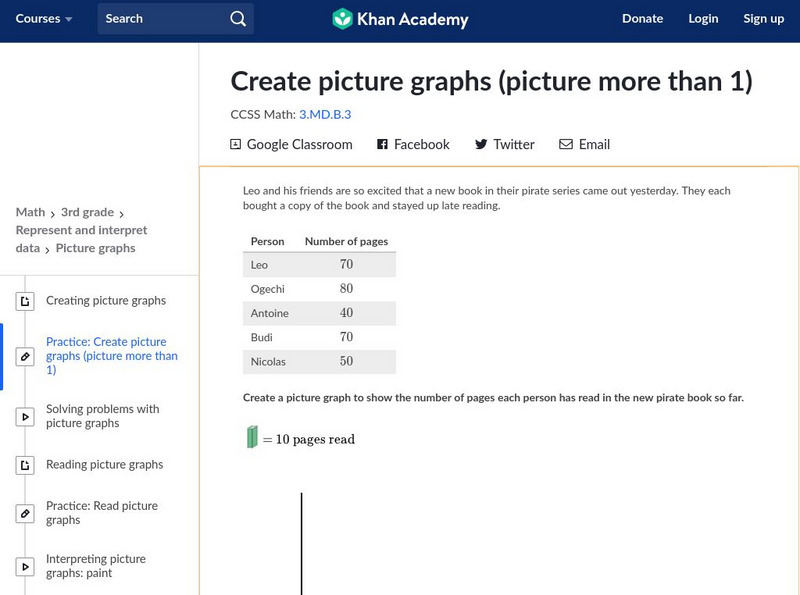
Khan Academy: Create Picture Graphs (Picture More Than 1)
Create and interpret picture graphs. Students receive immediate feedback and have the opportunity to try questions repeatedly, watch a video tutorial, or receive hints about how to create picture graphs. CCSS.Math.Content.3.MD.B.3 Draw a...
Better Lesson
Better Lesson: Graphing Our Snack Mix: Review of Graphing
Second graders review how to make bar graphs, line plots, and pictographs by tallying the contents of snack mix and building graphs to show their data.
Better Lesson
Better Lesson: Class Surveys and Graphs
Students love graphing data that they "own". For this plan, the class will select a type of graph and create it using a class survey frequency table. Included in this lesson are videos of the class engaged in the lesson and samples of...
Alabama Learning Exchange
Alex: Great Golly Graphs
This lesson plan asks middle schoolers to create a survey project including graphs, questions, tables, and data analysis. It gives an assessment and ideas for remediation and extension as well as ways to manage behavior problems and...
E-learning for Kids
E Learning for Kids: Math: Wizards: Graphs
Join the Magic Wandia Games and learn all about graphs!


