Scholastic
Study Jams! Choosing the Correct Graph
With so many types of graphs, don't let your learners get stuck figuring out which one to use. To track how Zoe spent her allowance, use this interactive lesson to review all the types of graphs and pick the best one to display the data....
Curated OER
Graphs - Online Activity
In this interpreting graphs worksheet, students complete an on-line activity in which they read both a line graph and a bar graph. They answer questions about how many of each letter is shown on a line graph and how many of each child's...
CK-12 Foundation
Graphs for Discrete and for Continuous Data: Discrete vs. Continuous Data
Not all data is the same. Using the interactive, pupils compare data represented in two different ways. The learners develop an understanding of the difference between discrete and continuous data and the different ways to represent each...
Shodor Education Foundation
Data Flyer
Fit functions to data by using an interactive app. Individuals plot a scatter plot and then fit lines of best fit and regression curves to the data. The use of an app gives learners the opportunity to try out different functions to see...
Curated OER
Graph Made Easy: Post Test
In this graphs worksheet, students answer multiple choice questions about line graphs and bar graphs. Students answer 10 questions total.
CK-12 Foundation
Understand and Create Histograms: Car Sales
Create a history of car sales. Pupils create a histogram/bar graph to show the number of car sales made during the week. Using the data display, learners calculate numerical summaries of the data and find the percent of cars sold during...
Curated OER
Let's Graph It! Pre-Test
For this graphing worksheet, students complete a set of 10 multiple choice questions, clicking on a link to see correct answers or print the page.
Curated OER
Using Data to Make Graphs: Pretest
In this data worksheet, 5th graders answer multiple choice questions on data and graphs. Students answer 10 multiple choice questions.
Chemistry Collective
Chemical Potential: Staircase Demonstration
It's all uphill from here! Scholars examine the pattern of random particle motion up a staircase. The simulation shows how the linear increase in energy corresponds to an exponential decrease in particle concentration.
Curated OER
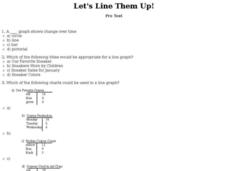
Let's Line Them Up!
In this line graph worksheet, students read through the problems about graphing and line graphs. Students select the best answer to solve the 10 online questions.
Curated OER
Using Data To Make Graphs
In this using data to make graphs worksheet, students interactively answer 10 multiple choice questions then click to check their answers.
Curated OER
Pictures of Data: Post Test
In this data worksheet, students answer multiple choice questions about charts and graphs. Students answer 10 questions total.
Curated OER
Let's Graph It
In this let's graph it worksheet, student interactively answer 10 multiple choice questions about graphing data and types of graphs, then click to check their answers.
Curated OER
Graph Made Easy-Pre Test Questions
In this graphing pre test learning exercise, students complete a set of 10 multiple choice questions. Page is labeled as a pretest, an answer link is provided.
US Department of Education
Nces: Create a Graph: Kids Zone
Make your own pie, bar, line, area or XY graph with this interactive tool. Look for examples of graphs already created from data collected by the National Center for Education Statistics. Complete with a graphing tutorial.
Shodor Education Foundation
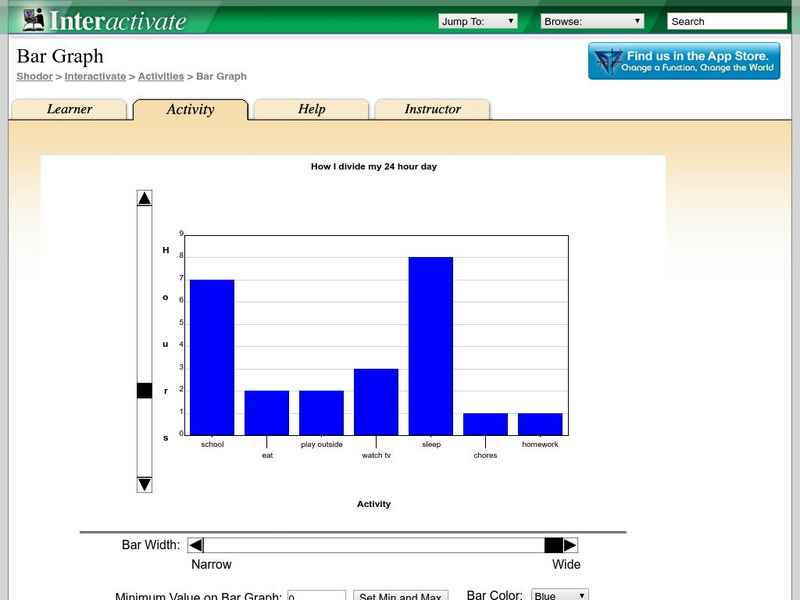
Shodor Interactivate: Bar Graph
A wonderful tool and learning experience using a bar grapher. This site contains an interactive bar grapher and much more! Follow the "What?" link to get to classroom resources such as problems and explorations.
National Center for Ecological Analysis and Synthesis, University of California Santa Barbara
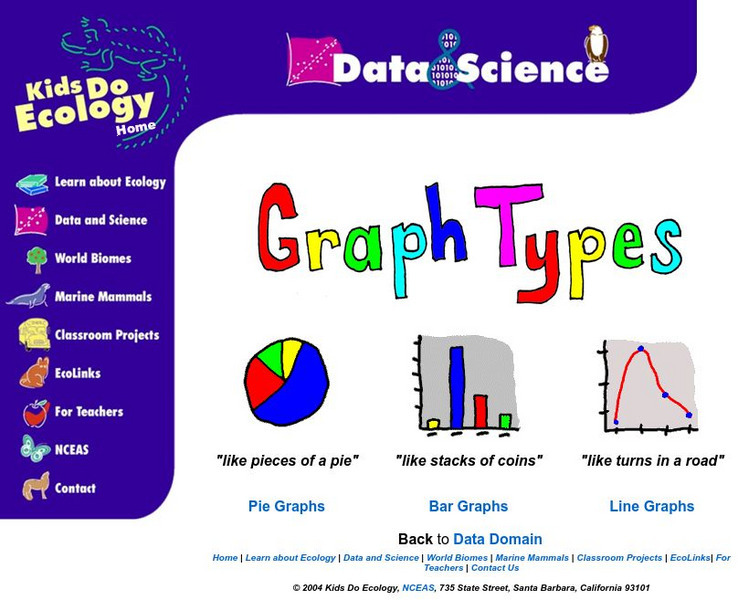
Nceas: Graph Types
At this site from NCEAS you can learn how to organize your data into pie graphs, bar graphs, and line graphs. Explanations and examples are given of each graph along with several questions that check comprehension.
Other popular searches
- Line Pie Bar Graph
- Line/bar Graph
- Line and Bar Graphs
- Line Bar and Circle Graphs
- Line Graph Bar Graph
- Line, Bar, and Circle Graphs
- Line, Bar and Circle Graphs
- Double Bar Line Graphs


