EngageNY
Interpreting Quadratic Functions from Graphs and Tables
Seeing functions in nature is a beautiful part of mathematics by analyzing the motion of a dolphin over time. Then take a look at the value of a stock and maximize the profit of a new toy. Explore the application of quadratics by...
College Board
Reasoning from Tabular Data
Don't table the resource—use it now. An AP® Calculus curriculum module encourages the use of tabular data throughout the course. It provides some example topics, such as rate of change, net change, and average value of a function, where...
Flipped Math
Calculus AB/BC - Using the Mean Value Theorem
At some point the rate of change must be the average. Pupils first see the definition of the Mean Value Theorem and hear an explanation of it in simple terms. The helpful video then compares the Mean Value Theorem with the Intermediate...
Curated OER
Mini Examination #2 - Limits and Derivatives
In this limits and derivatives worksheet, students solve 18 multiple choice and short answer questions. Students find the limits and derivatives of functions.
Illustrative Mathematics
The High School Gym
Learners apply critical thinking skills as they analyze data about the temperature inside a gymnasium during a school assembly. The focus is on representing temperature as a function of time and interpreting input and output values...
Mathalicious
The Fall of Javert
Falling off a bridge might not sound like your idea of a good math problem, but incorporating the final scene of Les Misérables is sure to spark interest. The goal is to use the time Javert fell off the bridge to determine how high he...
Curated OER
Rates Of Change
Students investigate the rate of change and how it effects a function over a given interval. They examine the slope of a line that is seccant and how it is compared to a tangent line and then determine the changes of a function at any...
Mathematics Common Core Toolbox
Golf Balls in Water
Here's a resource that models rising water levels with a linear function. The task contains three parts about the level of water in a cylinder in relationship to the number of golf balls placed in it. Class members analyze the data and...
Rice University
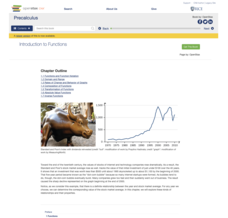
Precalculus
Take a step beyond Algebra 2. Learners use the eBook to learn concepts from the typical Precalculus course. Content starts off with a short review of functions in general and moves on to the basic functions, finishing up with more...
Curated OER
Slope & Rate of Change
This short handout addresses the concept of slope in two different ways: geometrically and analytically. Start with a brief description of slope, then use graphical representations to compare positive vs. negative slope and zero vs....
Curated OER
Taking Its Toll
Students explore ratios. In this rates lesson, students create a ratio to compare the price of a toll to the distance travelled. They compute the average cost per mile, determine the slope between two ordered pairs, and make...
Curated OER
Logarithmic Functions
Learners explore the characteristics of logarithmic functions and their relationship to exponential functions. Using the subscriber website Explorelearning.com, pupils observe changes in the input variable and its effect on the graph of...
Curated OER
Average and Instantaneous Velocity
In this velocity activity, students determine the average velocity for a trip, graph the distance traveled as a function of time, estimate the slope and identify the instantaneous rate of change of the function. This two-page activity...
Willow Tree
Line Graphs
Some data just doesn't follow a straight path. Learners use line graphs to represent data that changes over time. They use the graphs to analyze the data and make conclusions.
PBL Pathways
College Costs
Predict the year that college costs will double in your state using linear modeling. The first part of this two-part project based learning activity asks young mathematicians to use data from the College Board. They graph the data, write...
Curated OER
AP Calculus
In this calculus worksheet, students solve problems with trigonometric functions. They take the derivative and find the average rate of change.
Curated OER
Sandia Aerial Tram
Your learners analyze a table of real-life data in order to write an equation that best models the information. Exponential, quadratic, and linear rates of changes are all possibilities in this task.
Curated OER
Exploring Derivatives Using Lists
Learners explore lists and determine the derivative for that list. They use regressions to discover equations.
Curated OER
A.P. Calculus Exam Prep
In this A.P. Calculus exam practice test, students answer 28 multiple choice questions. Questions cover a wide variety of topics. Students tell the position of a particle moving along a horizontal line. They identify the solution to a...
Curated OER
Partial Derivatives for a Function of Two Variables
For this partial derivatives worksheet, students complete one word problem by finding the (x,y) coordinates of a point when it moves parallel to one axis. When given a function, they find six partial derivatives. Students solve four...
Curated OER
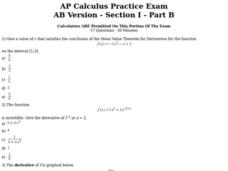
AP Calculus Practice Exam
In this practice exam worksheet, students solve 17 multiple choice problems. Students find derivatives, points of continuity, maximums, minimums, integrals, and area of enclosed regions.
Curated OER
The Derivative
In this derivative learning exercise, students estimate the derivative of given functions. They identify the slope, the rate of change find the slope of a parabola. This two-page learning exercise contains definitions, examples and...
Mascil Project
Drug Concentration
Different medications leave the body at different rates, and how people take them determines their effectiveness. Learners investigate this effectiveness by charting the concentration of a given medication in the body. Using exponential...
Curated OER
A Simple Model for Atmospheric Carbon Dioxide
In this atmospheric carbon dioxide worksheet, students use two diagrams to solve 6 problems about atmospheric carbon dioxide. One diagram shows the Keeling Curve and the other shows sources of carbon and the natural and anthropogenic...


