Curated OER
Converging Series
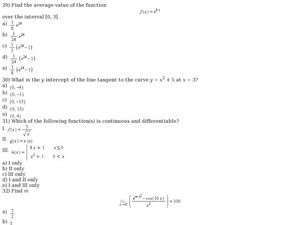
In this functions instructional activity, students calculate the average value, continuity, and the radius of convergence. There are 17 multiple choice questions.
Curated OER
Average Value of a Function
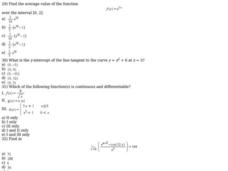
In this calculus worksheet, 12th graders calculate the line tangent to a curve and find the average value of a function. There are 12 questions.
Curated OER
Worksheet 8, Exponents
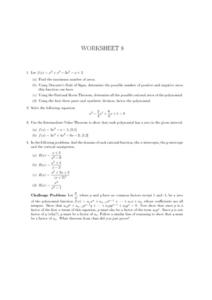
In this calculus worksheet, learners analyze one equation by finding the maximum number of zeros. They use Descarte's Rule of Signs and the rational roots theorem. Students use synthetic division to factor the polynomial. Learners solve...
Curated OER
Worksheet 11
In this math activity, students define a function f(x) by the following rule: for any x ∈ R,set. They also define the domain and range for the functions.
Curated OER
Graphs and Equations of Conic Sections Practice Test
In this conic section worksheet, learners complete a thirty-one question practice test containing matching and problem solving conic equation and conic graph problems. The solutions are provided.
Curated OER
Rational Functions
Students evaluate rational functions. In this precalculus lesson, students make observations and define what makes a rational function and what makes a linear function. They use the Ti calculator to visualize the different graphs.
Curated OER
Roller Coaster Robot
Young scholars calculate the area under a curve. In this calculus lesson plan, students use Riemann sums to find and approximate the area under a curve. They use the derivative and differential equations to solve.
Curated OER
Rational Function Graphs
Young scholars use algebraic methods to represent and solve problems. Using a graphing calculator, students solve rational and inequality problems. They visually demonstrate solutions of functions through graphing. Young scholars...
Other popular searches
- Horizontal Asymptotes
- Vertical Asymptotes
- Exponential Asymptotes
- Graphing With Asymptotes
- Asymptotes and Curvatures


