Curated OER
Rise Over Run
Students define the slope of the line, find the slope between any two points on the line, and allow them to name other areas where the slope is used. They explain why the slope is defined as the rise over the run.
Curated OER
Parabolas
Learn how to evaluate the derivatives of polynomials. Mathematicians find the derivative of a quadratic function and determine the value at a given value. High schoolers compare the slope of the secant line through two points with the...
Curated OER
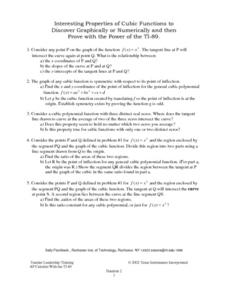
Interesting Properties of Cubic Functions to Discover Graphically or Numerically
Learners investigate the slope of a cubic function. They find the tangent line of the cubic function at point P, and discuss the relationship between point P and point Q, the point the tangent line intersects the cubic function. They...
Curated OER
Slope
Students calculate the slope of a line. In this slope lesson plan, students use a graph, an equation or two points to help them calculate the slope of a line. They differentiate between a slope of zero and an undefined slope.
Curated OER
Geometry and Geoboard
Sixth graders use geoboards and dot paper to experiment with geometric concepts. In this geometry lesson, 6th graders complete four activities using geoboards or dot paper including naming points on a coordinate plan and finding the area...
Curated OER
Steppin' Out
Learners are presented with the question: "Do longer legged people run faster than shorter legged people?" Students conduct an experiment, collect their data, create box and whisker plots using a computer and graphing program, and...
Curated OER
Graphing Fun In Third Grade
Third graders display information in a graph, table, and chart. In this data lesson plan, 3rd graders look at graphs, tables, and charts, discuss their importance, and make their own.
Teach Engineering
Forms of Linear Equations
Linear equations are all about form. The fifth part in a unit of nine works with the different equivalent forms of linear equations. Class members become familiar with each form by identifying key aspects, graphing, and converting from...
EngageNY
Problem Solving and the Coordinate Plane
Class members investigate rectangles on the coordinate plane. They determine the length of line segments in the coordinate plane with the same x-coordinate or same y-coordinate and then solve geometric problems involving perimeter and...
Teach Engineering
Applications of Linear Functions
It's not so straightforward — lines can model a variety of applications. Pupils experience linear relationships within the context of science, including Hooke's and Ohm's Laws. Class members got a taste of motion and speed from the...
Project Maths
Integral Calculus
From derivatives to antiderivatives and back again. Building on the second lesson of the three-part series covering functions, learners explore the concept of an antiderivative. They connect the concept to the graph of the function and...
Curated OER
Slopes of Lines
Students examine a graph and relate it to the real world situation it depicts. They investigate changes in an equation and the appearance of a line. They investigate the connection between the graph of a situation and the meaning of the...
Curated OER
Graphing the Past Using Today's Technology
Eighth graders research statistical data regarding their current social studies unit. They write questions about the measures of central tendency, collect and analyze the data, insert the data into a spreadsheet, and generate graphs.
Curated OER
Using Excel to Reference and Graph Live Data from a Web Site
Students collect live buoy data about water temperatures in the Gulf of Mexico from the Internet and work individually to organize their data and create a line graph using Excel Spreadsheet. Students analyze their data and examine any...
Curated OER
No Title
Sixth graders, after reviewing and studying the basics of recording, analyzing and presenting data, create on graph paper a bar or line graph to represent given data and then interpret the data. They answer questions about the given data...
Curated OER
Worksheet Five - Limits
For this limit worksheet, students use algebra to compute limits. They find the slope of the secant line and find a formula giving the slope of the secant line. This one-page worksheet contains six multi-step problems, with answers.
Curated OER
Graphing Favorite Holidays
Students create spreadsheets and bar graphs based on results of survey of favorite holidays.
Statistics Education Web
Walk the Line
How confident are you? Explore the meaning of a confidence interval using class collected data. Learners analyze data and follow the steps to determine a 95 percent confidence interval. They then interpret the meaning of the confidence...
Curated OER
Life Expectancy at Birth
Students create a line graph on the life expectancy for males and females in Canada. In this math and health lesson plan, students review table and graph terminology, create line graphs, and analyze the differences in life expectancy...
Curated OER
Let's Go Slopey
Students create a table of values to graph a line. In this algebra instructional activity, students identify the slope and intercept of a linear equation. They use a Ticalculator to graph their function.
Curated OER
Data Collection - Primary Poster
Students explore the concept of collecting, analyzing, and graphing data. In this collecting, analyzing, and graphing data lesson, students create a survey about a topic of interest. Students poll their classmates, analyze, and graph...
Curated OER
Cruising the Internet
Students identify the parts of an engine using a graph. For this statistics lesson, students make a graph from their collected data. They calculate the volume of a cylinder using a line of regression and a scatter plot.
Curated OER
Local Traffic Survey
Students conduct a traffic survey and interpret their data and use graphs and charts to display their results.


