EngageNY
Counting Problems
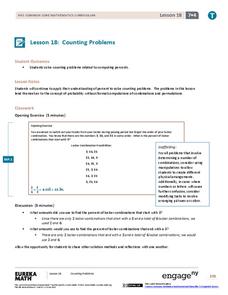
Solving these percent problems is a matter of counting. Pupils find percents by counting the number of events that meet the criteria and the total number of possibilities. Participants create the ratio and convert it to a percent to...
EngageNY
Comparing Integers and Other Rational Numbers
The ninth installment of a 21-part module has pupils compare integers and rational numbers in decimal and fraction form. They match stories to number lines and compare values in the stories.
EngageNY
Statements of Order in the Real World
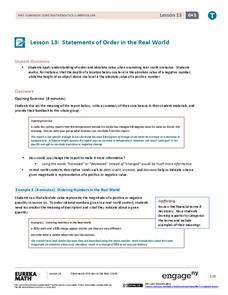
Positive and negative numbers are all around us. Groups read short story contexts and identify a rational number that represents the values in the context. They order the rational numbers and interpret statements of inequality.
EngageNY
Ordered Pairs
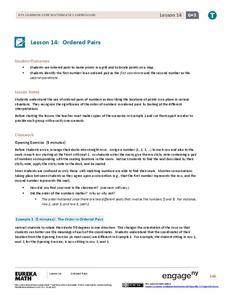
Scholars learn to plot points on the coordinate plane. The instructional activity introduces the idea that the first coordinate of a coordinate pair represents the horizontal distance and the second coordinate represents the vertical...
EngageNY
One-Step Problems in the Real World
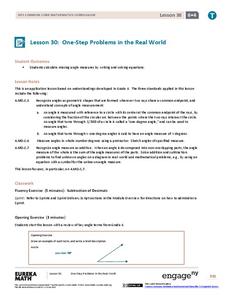
Mirror, mirror on the wall, which is the fairest resource of them all? Individuals write and solve one-step equations for problems about angle measurement, including those involving mirrors. Both mathematical and real-world problems are...
EngageNY
Describing Distributions Using the Mean and MAD
What city has the most consistent temperatures? Pupils use the mean and mean absolute deviation to describe various data sets including the average temperature in several cities. The 10th lesson in the 22-part series asks learners to...
EngageNY
Describing the Center of a Distribution Using the Median
Find the point that splits the data. The instructional activity presents to scholars the definition of the median through a teacher-led discussion. The pupils use data lists and dot plots to determine the median in sets with even and odd...
EngageNY
Connecting Graphical Representations and Numerical Summaries
Which graph belongs to which summary statistics? Class members build upon their knowledge of data displays and numerical summaries to connect the two. Pupils make connections between different graphical displays of the same data in...
EngageNY
Summarizing a Data Distribution by Describing Center, Variability, and Shape
Put those numbers to work by completing a statistical study! Pupils finish the last two steps in a statistical study by summarizing data with displays and numerical summaries. Individuals use the summaries to answer the statistical...
Curated OER
Space and Shape in Geometry:
Students are asked to visualize three-dimensional figures and apply this visualization to problem solving.
Curated OER
Telescoping Sums Theorem
In this math worksheet, young scholars read the information and examples that progressively prove the Telescoping Sums Theorem. They work the examples on their own.
Curated OER
Division Problems with 0 and 1
Students explore beginning division. In this division number properties lesson, students solve simple division story problems using cookies. Students create models that represent the identity and zero properties, then write explanations...
Curated OER
Fractal and the Dragon Curve
Students explore Fractal designs. In this geometry lesson, students observe the different polygons created in nature and relate it to math. They define polygons on planes and rotate polygons about a point.
Curated OER
Applied Science - Science and Math Lab (read without sight)
Learners consider the senses. For this sight and touch lesson, students discover what it is like to function like a person who is blind. They work in groups and individually on various activities to experience this condition. This lesson...
Curated OER
Applied Science-Science and Math (2A) Post Lab
Second graders create a graph about TV watching. In this bar graph lesson, 2nd graders make a hypothesis about how much TV 2nd graders watch per week. They record their TV watching for a week and bring it to school to create a class...
Curated OER
Deal or No Deal?
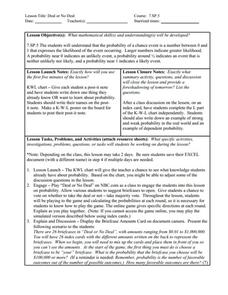
Using a game format, learners engage in an activity called Deal or No Deal. Taking real life scenarios involving items for sale, such as cereal boxes three for $5.00, they determine whether an example is a deal or not. This lesson...
Curated OER
Measuring Up
Students examine and discuss a variety of ways to measure length, capacity, and weight. They estimate and measure a pencil's length using Unifix cubes, estimate and fill a measuring cup with Unifix cubes, and weigh a calculator in a...
Curated OER
Addition and Subtraction Facts to 20
Fact families, and the relationship between addition and subtraction are the foucs of this lesson plan. Learners explore strategies to help with their addition and subtraction facts. They use doubles, related facts, and fact families to...
Curated OER
Systems of Linear Equations
Introduce the inverse matrix method to solve systems of linear equations both algebraically and graphically. Using given data, your class checks their answers with graphing calculators. Handouts are included in this well-thought out lesson.
Virginia Department of Education
Normal Distributions
Pupils work to find probabilities by using areas under the normal curve. Groups work to calculate z-scores and solve real-world problems using the empirical rule or tables.
Virginia Department of Education
Angles, Arcs, and Segments in Circles
Investigate relationships between angles, arcs, and segments in circles. Pupils use geometry software to discover the relationships between angles, arcs, and segments associated with circles. Class members use similar triangles to...
Virginia Department of Education
Permutations and Combinations
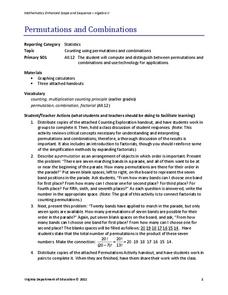
Counting is not all it adds up to be — sometimes it involves multiplying. The lesson introduces permutations and combinations as ways of counting, depending upon whether order is important. Pupils learn about factorials and the formulas...
Virginia Department of Education
Out of the Box
There's no need to think outside the box for this one! Scholars measure the length, width, and height of various boxes. Results help develop the formulas for the surface area and volume of rectangular prisms.
Curated OER
Chain Across the Hudson
Fourth graders role play as contractors responsible for constructing a chain across the Hudson River. They apply math skills to determine the total weight, number of links, and cost of the project.
Other popular searches
- Grade 9 Applied Math
- Applied Math Weight
- Applied Math Blueprint
- Applied Math 20
- Worksheets Applied Math
- Applied Mathematics
- Applied Math Parallel
- Applied Math Electricity
- Applied Math Exam
- Applied Math for Aviation
- Applied Math Store
- Applied Math Conservation
