Curated OER
A Proportional Fish Story
In this proportions activity, students identify and complete 8 different problems that include using proportions to build scale models of various animals. First, they use the scale to complete the chart and draw lines representing the...
California Academy of Science
How Big is Big?
In a math or life science class, "mini-me" models are created with cardstock to reflect a 1:10 scale of students' bodies. Learners measure each others' heights with meter sticks, and then reduce the size by 10. After this exercise, they...
Curated OER
Winter-time Temps
Students measure temperature and become aware the the temperature above and below the snow is different. In this winter temperature instructional activity, students measure temperatures to find variation based on how the snow is packed....
Curated OER
Photosynthesis
Students recognize the importance of plants as they perform an experiment involving photosynthesis. Students determine the optimum wavelength of light for photosynthesis by exposing plants to different colors of light, collecting data,...
Math Worksheets Land
My Favorite Animal At The Zoo Pie Graph
What is your favorite animal at the zoo? Young mathematicians answer eight multiple choice questions, based on a survey of 50 people presented in a pie graph. Additionally, the graph does not display any numbers, but rather different...
Curated OER
Third Grade Math
In this math review activity, 3rd graders answer multiple choice questions about probability, bar graphs, pictographs, and more. Students complete 25 multiple choice questions.
Concord Consortium
Gestation and Longevity
Is the gestation length of an animal a predictor of the average life expectancy of that animal? Learners analyze similar data for more than 50 different animals. They choose a data display and draw conclusions from their graphs.
Curated OER
Fish Communities in the Hudson
Learning to read data tables is an important skill. Use this resource for your third, fourth, or fifth graders. Learners will will study tables of fish collection data to draw conclusions. The data is based on fish environments in the...
Curated OER
Moooooove into Graphing
First graders explore graphing software and create their own graph of farm animals. Then students analyze their graph using the teacher made worksheet which is imbedded in this lesson plan. Great lesson!
Curated OER
Coral Reef Center Math
In this math worksheet, students find the solutions to the math problems with the use of the graphs using the theme of coral reefs.
Curated OER
Graphing Farm Animals
In this graphing worksheet, students use the pictures of the animals to in the graph to determine how many farm animals are in the graph. Students draw the farm animals that match the numbers. Students then complete farm animal pattern...
Curated OER
Farm Animal Graphing
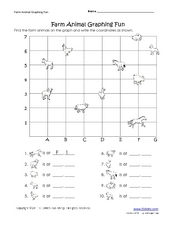
In this farm animal graphing worksheet, learners locate farm animals on a graph and rite the coordinates for each, 10 total. An answer key is given on page 2.
Curated OER
Zoo Animal Graphing Fun
For this graphing worksheet, 2nd graders locate the zoo animals on the graph and record the correct coordinates on the line. There are 10 sets of coordinates to record.
Curated OER
Woodland Math Facts
In this Woodland math facts worksheet, students study and examine woodland weights of trees and shrubs, explore invertebrates and draw a bar chart to chart their findings.
Curated OER
4th Grade Math Quiz
In this grade 4 math quiz worksheet, 4th graders complete a 15 question multiple choice quiz covering a variety of grade 4 concepts.
Curated OER
Animal Runners
In this collecting data worksheet, 4th graders use the data shown on how fast 6 animals can run to create a bar graph. Students follow the instructions on 3 directives for their bar graphs and answer 1 short answer question.
Curated OER
Wildlife Management
Students examine the effects of various management strategies on the size of wildlife populations. Each student simulates the management of an animal population in a card game, graphs the results of the wildlife game, and participate in...
Curated OER
When is Your Animal Most Active?-- Class Bar Graph
In this science and math activity, a group of students participate in graphing what time of day their chosen animals are most active. Students fill out the bar graph choosing day or night.
Curated OER
Use a Graph Reteach 4.8
For this graph worksheet, students solve 3 problems using a data table and bar graph. Students write number sentences to figure out answers to the questions about kinds of toys in a shop.
Curated OER
Tallying Animals
Second graders draw a picture of a pond scene which includes various animals. They exchange pictures and tally the number of animals drawn. Then they record the number on a chart and write a story about their pictures.
Curated OER
Location on a Grid
Make coordinate pairs more engaging by having beginners color-code a grid based on given locations. The grid has numbers along the y-axis and letters along the x-axis, introducing them to the ordering of coordinate pairs with the x-axis...
Curated OER
Food chains at sea
Fifth graders interpret a table of data about food chains in the ocean. They create a food chain to represent the information on the table. Periwinkles eat seaweed, and crabs eat periwinkles - so who eats crabs? Extend the activity with...
Curated OER
"who Lives in Your House?"
Fourth graders collect data about the people and animals living in their homes, and the students' shoe sizes. They work in groups to enter the information into a database from which they create graphs. They analyze the data to find the...
Living Rainforest
Finding the Rainforests
From Brazil to Indonesia, young scientists investigate the geography and climate of the world's tropical rain forests with this collection of worksheets.


