Statistics Education Web
The United States of Obesity
Mississippi has both the highest obesity and poverty rate in the US. Does the rest of the data show a correlation between the poverty and obesity rate in a state? Learners tackle this question as they practice their skills of regression....
101 Questions
Will It Hit The Hoop?
Basketball and math go hand in hand, even before one considers creating statistics. Viewers see a basketball player attempt multiple shots, but they do not see whether it goes in. They solve for which shots earned points as well as which...
National Institute of Environmental Health Sciences
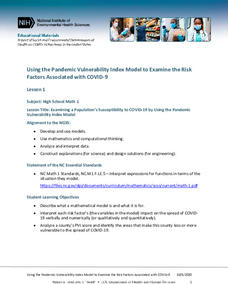
Lesson 1: Using the Pandemic Vulnerability Index Model to Examine the Risk Factors Associated with COVID-19
How vulnerable are you to COVID-19? High school mathematicians use the Pandemic Vulnerability Index to create models that help them collect and analyze data about the risk factors associated with COVID-19. After investigating four groups...
Curated OER
Does Music Cam the Savage Beast?
Students collect, graph and analyze data. In this statistics lesson, students measure the heart beat of a person as they listen to music. They use the CBL and TI to create a graph, analyzing the outcome.
Curated OER
Graphing Population Around the World
Students define specific vocabulary necessary for understanding population data. They collect, analyze, and interpret specific data. They utilize computer programs in order to create graphs of collected data.
Curated OER
Let's Get Physical
Students collect data using the CBL. In this statistics lesson plan, students predict the type of graph that will be created based on the type of activity the person does. The graph represents heart rate depending the level of activity.
Curated OER
Youth vs. Adult Employment
Students investigate the unemployment rate in Canada. In this statistics lesson, students collect data on youth finding jobs, graph and analyze the data. This assignment raises awareness of the employment problems in Canada.
Curated OER
Vote for Me!
Tenth graders analyze voter trends in South Carolina and discover techniques canddidates and their parties use to convince us to vote their way. They are able to locate voting statistics for their county; compare the number of...
Curated OER
Why Data
Students investigate and discuss why data is important. In this statistics lesson, students collect, graph and analyze data. They apply the concept of data and lines to finding the rate of change of the line created by the data.
Curated OER
Confidence Levels
Young scholars collect data and graph it. In this statistics lesson, students rate confidence levels by collecting data and analyzing it. They graph their findings on the Ti calculator.
Curated OER
Modeling Population Growth
Students collect data on population growth. In this statistics lesson, students graph their data and make predictions. They find the linear regression and the best fit line.
Curated OER
Student Costs Data Table
Students compare and contrast two routes selected for a virtual field trip. They create a data table of educational activities, lodging, and meal costs using Microsoft Excel software.
Curated OER
Exercise Those Statistics!
Students participate in various activities, measuring their pulse rates and recording the data. They analyze the statistical concepts of mean, median, mode, and histograms using the data from the cardiovascular activities.
Curated OER
A Look at Race in America Using Statistics
Eleventh graders explore the issue of racism in America. In this American History lesson plan, 11th graders analyze charts and graphs on blacks and whites in America.
School Improvement in Maryland
Socio-Economic Goals of the Government
Equity. Increased productivity. Price stability. Environmental protection. Decreased poverty. Governments establish socio-economic goals and then must design and fund programs to address these goals. Groups investigate various programs...
Curated OER
Data Comparison And Interpretation: North Korea, South Korea, And the United States
Ninth graders brainstorm "what they know about North Korea and South Korea." They determine the approximate distance from the United States to North and South Korea and create a graph comparing the birth rates, death rates, infant...
Curated OER
Teen Driving: Skills, Responsibilities and Reactions
As an introduction to the skills required for and responsibilities of driving, pre-teens and teens engage in a series of activities, chart their response times, and analyze how variables effect these reaction times. Class groups use the...
National Wildlife Federation
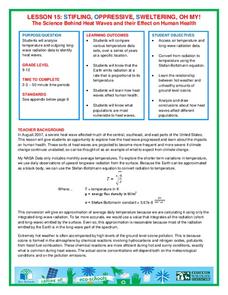
Stifling, Oppressive, Sweltering, Oh My!
Looking for a hot date? Pick any day in August, statistically the hottest month in the United States. The 15th lesson in the series of 21 instructs pupils to investigate the August 2007 heat wave through NASA data, daily temperature...
Curated OER
Population-Building a Foundation
Students research to find information about populations and complete world maps by labeling the current population, and determining the 10 countries with the largest population. They search the "World Population Data Sheet." On the third...
Curated OER
The Numbers Behind Hunger #1
Students investigate world hunger. In this global issues instructional activity, students research world hunger issues using the World Food Program website. Students analyze statistics and consider how to address word hunger issues.
Curated OER
The Baby Boom -- How Do We Know it is a Boom?
High schoolers examine graphs of three statistics and use basic math to compute their own. They evaluate the implications of manipulating data and whether statistics are appropriate for creating policy.
Curated OER
A RealSim Surface Look at Descriptive Statistics
Students explore the concepts of mean and variance. They observe properties of materials to their basic atomic or molecular structure. Students use spreadsheet software to record, tabulate and analyze collected information.
Kenan Fellows
Lego Thinking and Building
Run a simulated airplane manufacturing plant with your pupils as the builders! Learners build Lego airplane models and collect data on the rate of production, comparing the number produced to the number defective. Using linear...
EngageNY
Displaying a Data Distribution
Pupils analyze a display of data and review dot plots to make general observations about the highest, lowest, common, and the center of the data. To finish, learners match dot plots to scenarios.


