Other
Ocean Tracks: Fact or Artifact? Interpreting Patterns in Ocean Tracks Data [Pdf]
Ever wonder where marine animals go? How fast they swim? How deep they dive? Electronic tagging has opened a new window into the world of the open ocean. Ocean Tracks gives you access to data collected by tags on real live migrating...
Science Education Resource Center at Carleton College
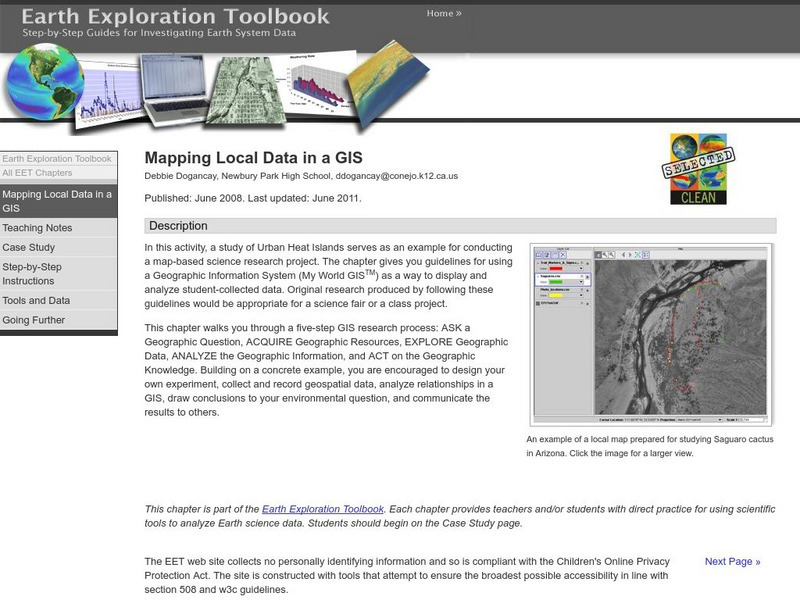
Serc: Mapping Local Data in a Gis
In this activity, students will learn how to conduct a map-based science research project using a Geographic Information System (GIS). They will design an experiment, collect and record geospatial data, analyze geospatial relationships...
Other
Bsi Education: Quantitative Analysis
The Applied Science resource consists of practical activities that demonstrate the importance of standard procedures in scientific work. Students analyze quantitative data through a variety of activities. An article, practice...
University of Wisconsin
Uw: Probabilities, Uncertainties and Units Used to Quantify Climate Change
This resource engages learners in using scientific data to analyze a 150-year dataset from Lake Mendota in Madison Wisconsin reflecting seasonal ice cover.
University of Arizona
Environmental Tobacco Smoke and Lung Development Activity
An interactive activity designed for you understand the scientific method and how to analyze your data. A step-by-step and personalized experiment geared toward the topic of toxicology.
Climate Literacy
Clean: Time Series: Uncovering the Hidden Processes in Science
In the following exercise, students will review techniques useful to scientists asthey analyze series of data. Learn about scientific observation and try to recognize a pattern or trend within the data.
Other
Terc: Online Science Athon: Find Out How Tall You Are
Create a Measuring Day at your school and teach your students how to use simple tools to gather, discuss and analyze their own data. This step-by-step lesson plan helps you design an unforgettable day for you and your students. Links to...
Science Education Resource Center at Carleton College
Serc: Analyzing P H: Comparing Citrus Fruits, Stain Removers and a Green Product
The students will analyze the pH of four citrus fruits: lime, lemon, orange, and a grapefruit, and then they will analyze the pH of four different types of stain removers: Shout Advanced, Spray 'n Wash Max, Oxi Clean Laundry, and Clorox...
Climate Literacy
Clean: Carbon Cycle
This activity from NOAA Earth System Research Laboratory introduces students to the current scientific understanding of the greenhouse effect and the carbon cycle. The activity leads them through several interactive tasks investigating...
Science Education Resource Center at Carleton College
Serc: Adventures at Dry Creek
This educational module enables students (5-12) to experience ongoing research of University of California paleontologists studying about life in Montana 60-70 million years ago. It gives students the opportunity to experience the...
ArtsNow
Arts Now Learning: Realizing the Power of Your Own Creativity [Pdf]
In this lesson, students interpret a poem called 'The Little Blue Engine' by adding music, movement, visual art, and drama. After performing their creation, they will discuss any mathematical and/or scientific connections that have a...
University of California
Ucmp: Adventures at Dry Creek
For this lesson, students embark on an adventure to find out what life was like in Montana 60-70 million years ago. Students "join" a research lab to collect fossils from Montana and analyze them to find direct and indirect evidence of...
Other
Learning Design Collaborative: Cer: Claim, Evidence, and Reasoning
Students write a scientific claim that is backed up by evidence and supported by scientific reasoning. Base your answer on your reading of a data table.
Science Education Resource Center at Carleton College
Serc: Litter Retriever With a Gps Receiver
Have you ever wondered why litter is in some locations and not others? You will use a Global Positioning System (GPS) to mark the locations of trash and trash cans around a local park or school campus, import the data into Google Earth,...
TeachEngineering
Teach Engineering: A Lego Introduction to Graphing
Students use a LEGO ball shooter to demonstrate and analyze the motion of a projectile through use of a line graph. This activity involves using a method of data organization and trend observation with respect to dynamic experimentation...
![Ocean Tracks: Fact or Artifact? Interpreting Patterns in Ocean Tracks Data [Pdf] Lesson Plan Ocean Tracks: Fact or Artifact? Interpreting Patterns in Ocean Tracks Data [Pdf] Lesson Plan](https://d15y2dacu3jp90.cloudfront.net/images/attachment_defaults/resource/large/FPO-knovation.png)


