Towson University
Looking Backwards, Looking Forward
How do scientists know what Earth's climate was like millions of years ago? Young environmental scholars discover how researchers used proxy data to determine the conditions present before written record. Grouped pupils gain experience...
Curated OER
Learning to Read Graphs 2
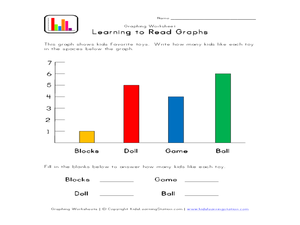
Do you like playing with blocks, dolls, games, or balls? Use this basic graph to review bar graphs with young learners. After completing the four questions below, consider creating your own class graph: who likes blocks the best? Who...
Wordpress
Introduction to Exponential Functions
This lesson begins with a review of linear functions and segues nicely over its fifteen examples and problems into a deep study of exponential functions. Linear and exponential growth are compared in an investment task. Data tables are...
CPO Science
Physics Skill and Practice Worksheets
Stop wasting energy searching for physics resources, this comprehensive collection of worksheets has you covered. Starting with introductions to the scientific method, dimensional analysis, and graphing data, these skills practice...
Curated OER
Favorite Vegetable Survey
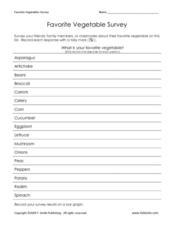
What's your favorite? Use this chart template in your lesson on data collection and graphing. Learners record classmates' favorite vegetable in a survey, and then graph the results. A labelled graph is provided here- print both pages...
Curated OER
Tides at the Battery, NY
Skill in using Excel and increasing proficiency in manipulating data are challenged with this data analysis work. A web link supplies data and step-by-step instructions help learners create a graph. There are many extension...
Curriculum Corner
Our Classroom Birthdays
Combine getting to know one another and math with a worksheet that focuses on graphing birthdays. Scholars collect data to discover how many peers share birthday months and fill in a bar graph for visual representation.
Towson University
The Crucial Concentration
Which sports drink provides the best pick-me-up after the big game or grueling workout? It may not be the one you'd think! Food science is the focus in a surprising lab activity. Pupils use colorimetry to determine the amount of protein,...
Curated OER
How Many Brothers And Sisters Do You Have? -- Class Bar Graph
In this math worksheet, students collaborate in generating a class bar graph which displays information about how many brothers and sisters each classmate has. Data is plotted on a bar graph.
Towson University
It's a Gassy World!
How much does your class know about the relationship between climate change and carbon dioxide? Science scholars explore the nature of greenhouse gases and rising ocean temperature through demonstrations, research, and experiments. The...
Curated OER
Food chains at sea
Fifth graders interpret a table of data about food chains in the ocean. They create a food chain to represent the information on the table. Periwinkles eat seaweed, and crabs eat periwinkles - so who eats crabs? Extend the activity with...
Curated OER
Which Kind of Weather Do You Like Best? -- Class Bar Graph
In this math worksheet, students generate a class bar graph. Classmates are surveyed about favorite weather: sunny, rainy, snowy, cloudy or windy. Results are displayed on a bar graph.
Curated OER
How Do You Like Your Sandwich? --class Bar Graph
In this math worksheet, students participate in a group bar graph activity. Students survey their classmates on favorite sandwich choices: peanut butter and jelly, grilled cheese or meat. Results are plotted on a bar graph.
Curated OER
Chance and Data - Data Collection
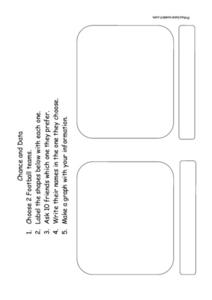
In this data and probability worksheet, students choose two football teams and label the graphic organizer. They question 10 friends as to which team they prefer and write their names in the organizer. They make a graph that displays the...
Curated OER
Horizontal Bar Graph-- Blank Grid
In this math activity, students use the blank horizontal bar graph to record and display any data and to learn the correct way to generate a bar graph. Spaces are marked for students to write in the title and labels; intervals of 1-10...
Curated OER
Favorite And Least Favorite Vegetable Survey and Bar Graph
In this favorite and least favorite vegetable survey, students create a bar graph after they survey and keep track of data on this graphic organizer.
Ohio Department of Education
Writing and Comparing Numbers in Scientific Notation-Grade Eight
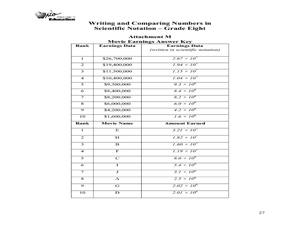
Explore scientific notation in this mathematics lesson. Young mathematicians explore multiple representations of large number in scientific notation through the use of models, visual representation and expanded form. The lesson provided...
NASA
Newton Car
If a car gets heavier, it goes farther? By running an activity several times, teams experience Newton's Second Law of Motion. The teams vary the amount of weight they catapult off a wooden block car and record the distance the...
Curated OER
When Do You Brush Your Teeth? --Class Venn Diagram
In this math worksheet, students collaborate to make a tally mark Venn diagram which shows what time of day students brush their teeth: morning, evening or both.
Curated OER
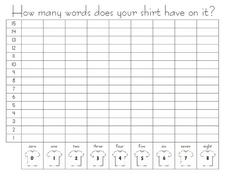
How Many Word Does Your Shirt Have on It? --class Bar Graph
In this math worksheet, students participate in a group bar graph activity. Students survey classmates about how many words, if any, are on their shirts. Results are plotted on a bar graph.
Curated OER
How Many Televisions Do You Have in Your Home?-- Bar Graph
In this math worksheet, students participate in a group graphing activity. Students survey classmates as to how many televisions are in each home and plot the results on a bar graph.
Curated OER
How Many Vowels Are in Your Name?-- Class Bar Graph
In this language arts/math worksheet, students collaborate to make a group graph. Students survey classmates about how many vowels are in names. Results are plotted on a bar graph.
University of Georgia
Heating and Cooling of Land Forms
Compare heating and cooling rates of different land forms. A lab activity has groups collect data on the rate of heating and cooling of soil, grass, saltwater, fresh water, and sand. An analysis of the rates shows how the different land...
University of Georgia
Energy Content of Foods
Why do athletes load up on carbohydrates the evening before a competition? The lesson helps answer this question as it relates the type of food to the amount of energy it contains. After a discussion, scholars perform an experiment...

