Mathematics Vision Project
Module 1: Sequences
Sequences are all about recognizing patterns. A module of 11 lessons builds pupils' understanding of sequences through pattern analysis. The practice connects the analysis to linear and exponential equations. This is the first module in...
EngageNY
Comparing Quadratic, Square Root, and Cube Root Functions Represented in Different Ways
Need a real scenario to compare functions? This instructional activity has it all! Through application, individuals model using different types of functions. They analyze each in terms of the context using the key features of the...
Mathematics Vision Project
Module 9: Modeling Data
How many different ways can you model data? Scholars learn several in the final module in a series of nine. Learners model data with dot plots, box plots, histograms, and scatter plots. They also analyze the data based on the data...
Mathematics Vision Project
Module 3: Features of Functions
Learn how to represent functions in multiple ways. Learners analyze functions as equations, graphs, and verbal descriptions. The analysis includes intercepts, behavior, domain, and range. The module of seven lessons makes up the third...
Curated OER
Tube Viewer Simulation
Students graph linear equations. In this algebra instructional activity, students discuss the effect the change in one variable has in an equation. They discuss the effect equations have if you chage the value of the variable.
Curated OER
Cook Me Up Some Equations
Students study a variety of math concepts in the context of cooking up a meal. In this math activity, students calculate surface area and volume. They draw and interpret different types of graphs.
Curated OER
MT-A315 Introduction to Linear Algebra
In this algebra learning exercise, students figure out the equation of the general vector, they find the orthogonal basis and apply the formula to solve the problems.
Curated OER
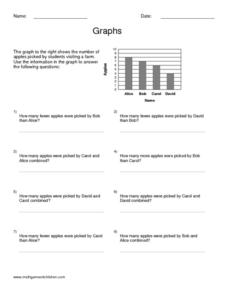
Graphs
In this algebra worksheet, learners solve linear equations through graphing and quadratic equations through factoring. There are 4 questions dealing with systems of equations.
Curated OER
Factoring Trinomials
Students factor trinomials using algebra tiles and blocks. In this algebra lesson, students complete a trinomials station activity. They work backwords to find their answers and discuss their steps in a group.
Curated OER
Arithmetic Revisions
In this algebra worksheet, students perform basic addition and subtraction operations by finding the missing digits. There are 30 questions dealing with multiplication, addition and graphing.
Curated OER
Transformations
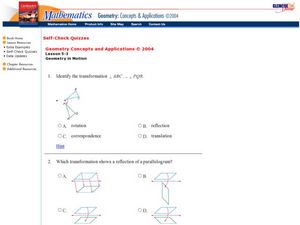
In this algebra learning exercise, students identify different transformations based on the x and y axis reflections. They use vectors to do their translations. There are 28 questions.
Curated OER
Graphs
In this algebra worksheet, students calculate the point of intersection between a circle and a straight line. There are 5 questions with an answer key.
EngageNY
Relationships Between Two Numerical Variables
Is there another way to view whether the data is linear or not? Class members work alone and in pairs to create scatter plots in order to determine whether there is a linear pattern or not. The exit ticket provides a quick way to...
Curated OER
Writing in the Math Classroom
Students determine the vertex, y-intercept and direction of a parabola and write an explanation of how to graph a parabola. They collect and graph data using a calculator.
Curated OER
The New Texas Two-Step
Sixth graders work with mathematical expressions by interpreting, analyzing and problem solving with them. In this two step algebraic problem solving lesson, 6th graders use algebra tiles to solve equations.
Curated OER
Spaghetti Graphs
Students work in pairs to test the strength of spaghetti strands. They collect and graph data to determine a line of best fit. Students create a linear equation to interpret their data. Based on the data collected, students predict...
Curated OER
Cantilevers
Young scholars perform an experiment to find the linear relationship between the appllied weight and the bend of the cantilever. In this linear relationships lesson, students follow detailed directions to set up an experiment. They add...
Curated OER
Telescope #2
Students investigate parabolas as the shape of a telescopic lens. In this Algebra I/Algebra II lesson, students explore the relationship between the coefficients of a quadratic function and the shape and position of the parabolic...
Alabama Learning Exchange
Solving Formulas for the Given Variable
Recycle, reuse, and rearrange! Young scholars learn to rearrange formulas to highlight a variable of interest. They then use their new formulas to make calculations.
Mathematics Vision Project
Module 7: Structure of Expressions
The structure of an expression is a descriptive feature. Learners build a solid understanding of quadratic functions using an analysis of expressions in different forms. The seventh module in a series of nine includes 12 lessons...
Mathematics Vision Project
Module 1: Sequences
Take steps into sequences. An 11-lesson unit builds upon pupils' previous understanding of writing expressions to develop the idea of sequences. The resource explores both arithmetic and geometric sequences using recursive and explicit...
Education Development Center
Points, Slopes, and Lines
Before graphing and finding distances, learners investigate the coordinate plane and look at patterns related to plotted points. Points are plotted and the goal is to look at the horizontal and vertical distances between coordinates and...
Curated OER
The Demise of Copper's Trading Power
Eighth graders evaluate statistical equations. They examine data from archaeologists at Jamestown, complete statistical equations using the sets of data, and graph the results.
Curated OER
Oodles of Poodles
Students solve equations by graphing. In this algebra lesson, students differentiate between functions and relations. They use the TI to graph their equation and analyze the graph.


