Curated OER
Air Pressure & Barometers
Fourth graders observe, measure, and record data on the basic elements of weather over a period of time (i.e., precipitation, air temperature, wind speed and direction, and air pressure). Then, they make a barometer and keep record of...
Curated OER
Too Heavy For Me
Students explore the different arrangement of air molecules in high and low air pressure masses. They compare the temperature of high and low pressure masses and discover how a barometer works.
Curated OER
High Mountain Retreat
Students explore and analyze atmospheric conditions for a high mountain retreat. They examine the relationship between altitude, atmospheric pressure, temperature and humidity at a particular location. In addition, they write reports...
Yummy Math
Deflate-gate
Does temperature affect the air pressure of a football? Young mathematicians look at the readings from a pressure gauge and determine if the balls are within regulation or are under inflated.
Curated OER
Balloons: Math with the Montgolfier Balloon
Young scholars discover the history of hot air balloons by watching one ascent. In this physics lesson, students utilize a Montgolfier Hot Air Balloon from an earlier lesson and record the temperature, rate of ascent and the...
Curated OER
Weather Variables Lab
Students examine what happens when air temperature drops and gets closer to the dewpoint. They perform a lab activity which illustrates the effects on humidity, precipitation and barometric air pressure.
Curated OER
Understanding Cloud Formation
Students explore air and clouds by watching demonstration. They perform an experiment to measure air pressure changes.
Curated OER
Using Standard Deviation, part 2
Students explain and learn the practical application of standard deviation. They compare cities in the U.S. and discover whether cities closer to the ocean have more consistent temperatures. Useful resources are given.
Curated OER
Weather Chart
Students select at least 6 cities from around the world to keep track of their high and low temperatures over a period of time.
Curated OER
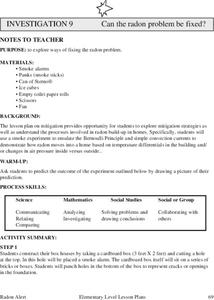
Can The Radon Problem Be Fixed?
Pupils participate in lab activities in which they examine the radon level in homes. They demonstrate through convection currents how radon moves through a home based on temperature. They predict what they believe will occur during the...
Curated OER
Weather Watchers
Students identify basic weather instruments and how they are used to record weather data. Students define several vocabulary terms as stated in lesson. Students use basic instruments to record weather data in their area. Students use the...
Teach Engineering
Equal and Opposite Thrust in Aircraft: You're a Pushover!
It's the law—every action requires a reaction, no matter how small. Pupils experience two demonstrations of Newton's third law of motion as it relates to thrust in the 10th segment of a 22-part unit on flight. Using their mathematical...
Curated OER
Weather instruments
Students explore weather instruments. In this weather lesson, students make rain gauges, anemometers, and barometers following the instructions given in the lesson. Students set up a weather station using their instruments and record and...
Curated OER
Understanding Cloud Formation
Students read and relate the poem, "Clouds" by Aileen Fisher to a demonstration on cloud formation. They create clouds in jars using ice water and matches then discuss the ways clouds can be used to predict weather.
Curated OER
Surface Meteorological Observation System (SMOS)
Students monitor local surface weather conditions for at least 30 days. They interpret the data by graphing it and detemining percentages.
Other
National Physical Laboratory: The History of Length Measurement
This resource provides historic information on length measurement in the United Kingdom. Click on the topics on the left toolbar of the article to find out more information.


