PBS
Population Simulation with M&M's
Math and M&Ms® go great together when introducing a modeling activity. Allow your learners to simulate population growth and decay of fish in a pond and share their reasoning for the change in fish. With such an impact we have on our...
Workforce Solutions
Miniature Gulf Coast Project
Scholars show what they know about data collection and analysis with an activity that examines a smaller population of Houghton, Texas. Independently or in pairs, learners identify their research question, gather, graph, and analyze...
Curated OER
Ranging the Triple M's
Fifth graders explore collecting and analyzing data. In this mean, median and mode lesson, 5th graders use real word data to determine the mean, median and mode. Students are given sets of numbers on index cards as asked to find the...
Curated OER
Data Analysis and Probability: Graphing Candy with Excel
Collect and graph data using Microsoft Excel with your math class. They will make predictions about the number of each colored candy in a bag of M&M's, then sort, classify, count, and record the actual data before using Excel to...
Curated OER
TE Activity: The Boxes Go Mobile
Students create a mobile of boxes and cubes that they made in a previous lesson that can be accessed from this page. They design the mobile using method that an engineer would use to balance the items based on surface areas and volumes.
Curated OER
Explore Learning Exponential Functions
High schoolers graph exponential equations and solve application problems using exponential functions. They re-enact a story about a peasant worker whose payment for services is rice grains doubled on a checker board. They place M &...
Curated OER
Exponential Functions
Students graph exponential equations of the form y=Ma. They understand the effects of M, a, and k on the graph. They solve application problems using exponential functions.
Curated OER
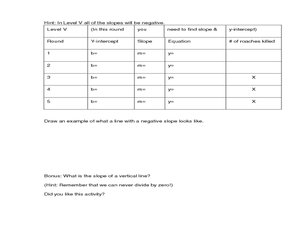
Cockroach Slope
Students identify the slope of linear functions. For this slope lesson, students collect data and graph it. They write equations with no more than two variables and use technology to explain their data.
Curated OER
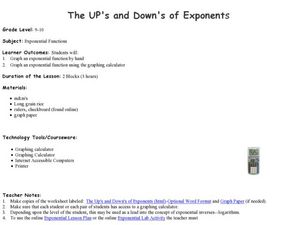
The UP's and Down's of Exponents
Students explore the concept of exponents. In this exponential functions worksheet, students complete provided worksheets that require them to graph exponential functions by hand as well using graphing calculators.
Curated OER
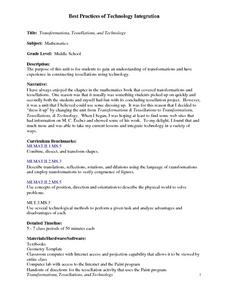
Transformations, Tessellations, and Technology
Middle schoolers complete a unit about transformations and tessellations. They explore various tessellation websites, determine which shapes tessellate, complete a log about which website activities they complete, and create a...
Curated OER
Balancing Equations
Students balance equations using the correct method. In this algebra lesson, students solve linear equations using a virtual balance beam as a manipulative. They play games to reinforce the concept of equations being and staying balanced.
Curated OER
Pythagorean Theorem
Eighth graders draw right triangles and identify the parts of a right triangle: right angle, interior and exterior angles, hypotenuse and legs. They predict and identify any relationships that exist between the sides of a right...
Curated OER
Migration of the Neo-Tropical Songbirds
Fifth graders plot the migration of birds using Google Earth. For this lesson on bird migration, 5th graders work in groups to plot the migration of a group of birds using Google Earth. Students present and discuss their findings and...
Curated OER
Survey Project
Eighth graders create a website using FrontPage. They use inserted forms to collect survey information and use Microsoft Excel and MS Word to create a presentation of the survey and the results.
Curated OER
Candy Colors: Figuring the Mean, Median, and Mode
Students count candy by color and then calculate mean, median, and mode. They count candy and use the data to calculate mean, median, and mode (by color) and apply their learning to another collection of data.
Curated OER
A Bar of Many Colors
Second graders use colored candies to collect data, construct double bar graphs, and find averages.
Curated OER
Double Dipping
Fifth graders determine how many double scoop combinations they can make using 5 different ice cream flavors. Then they use Microsoft Publisher to create a brochure for their ice cream shop.
Curated OER
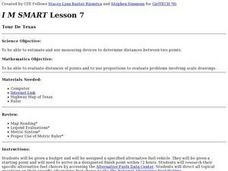
Tour De Texas
Young scholars are given a budget and an alternative-fuel vehicle. Using a map of Texas, they are given a starting point and determine how to arrive at their destination within 72 hours. They use the internet to research the...
Curated OER
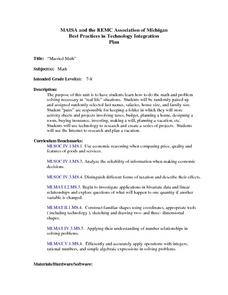
Married Math
Students participate in a two-week real-life math unit. In pairs, they calculate salaries, taxes, and a budget, plan a vacation, buy insurance, make a will, and design a room. They conduct Internet research to plan the vacation, and...
Curated OER
"Slice of Pi with Neo-Excel"
Students explore diameter, radius, and circumference. They define radius, diameter, and circumference on an online dictionary, identify objects in the room with a radius and a diameter, and calculate the radius and diameter of various...
Curated OER
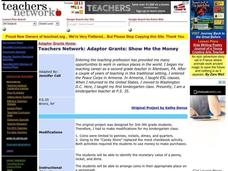
Show Me the Money
Students study the monetary value of a penny, nickel, and dime. They simulate a candy store by calculating the proper amount of money needed to purchase candy. After viewing a video, they complete the "Handful of Coins" pictograph .
Curated OER
Pretty Patterns
Students discuss shape and number patterns and play a game practicing completing patterns. Then they rotate through five workstations that reinforce the concept of patterning.
Curated OER
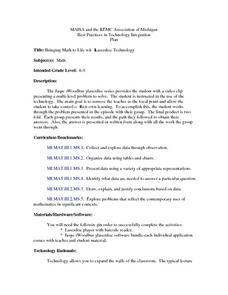
Bringing Math to Life with Laserdisc Technology
Students explore various problems. They present their final results and explain the path they followed in order to obtain their answers. Students show their written work as well as orally explaining their work.
Curated OER
PASS the Arts
Students explore math and art concepts, create digital art examples of the concepts, and incorporate these works into a PowerPoint portfolio with explanation and analysis.


