Curated OER
Investigation-Mathematical Reasoning: Tables and Chairs
Fourth graders design a table and chair arrangement. In this mathematical reasoning lesson, 4th graders place tables shaped like equilateral triangles so that they seat the appropriate number of guests.
Curated OER
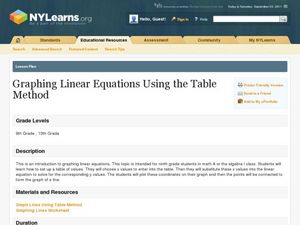
Graphing Linear Equations Using the Table Method
Students graph linear equations using a table. In this algebra lesson, students create a table of values using the linear equation to find the y-values. They plot their point on a coordinate plane and graph the line.
Mathematics Assessment Project
Generalizing Patterns: Table Tiles
As part of a study of geometric patterns, scholars complete an assessment task determining the number of tiles needed to cover a tabletop. They then evaluate provided sample responses to see different ways to solve the same problems.
PBS
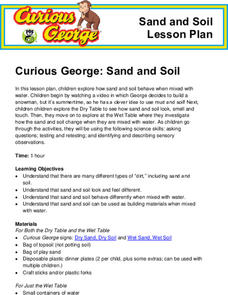
Curious George: Sand and Soil
Two sensory tables—wet and dry—allow scholars to use their sense of sight, touch, and smell to observe the changes when the dirt mixes with water. A short video relates the STEM learning experience to a fun video clip where Curious...
Space Science Institute
The "All American" Eclipse Guide
Are you ready for the biggest astronomical event of the year? More importantly ... are you ready to share it with your scholars? Use a presentation filled with facts and diagrams to make sure everyone in class understands the importance...
Curated OER
Jim's Table
Students analyze given number table and insert numbers working with a partner. Class share their ideas and solutions and answer specific questions about the table discussing their answers.
Curated OER
Graphing Fun In Third Grade
Third graders display information in a graph, table, and chart. In this data lesson plan, 3rd graders look at graphs, tables, and charts, discuss their importance, and make their own.
Curated OER
The Blizzard of 1993
Pupils read and interpret the information from a barograph from a major winter storm. This task assesses students' abilities to interpret and analyze graphs, construct data tables and graphs, generalize, infer, apply knowledge of...
Curated OER
Activity #4 Ground Water Model In a Jar
Students devlop a model, which they illustrate a water table and allow for the discussion of common terms and illustrate what those terms mean. They comprehend that a flow rates, removal of contaminants, and the amount of water stored...
Curated OER
Algebra- Cell Phone Plans
Students analyze graphs to compare cell phone plans. In this algebra lesson, students work together to analyze phone plans and report the best phone plan. Students develop tables and graphs.
Curated OER
Word Problems
Students solve word problems using mathematical symbols. In this algebra lesson, students collect data and analyze it. They analyze the data using a table or graph after plotting the data.
Curated OER
The Why and How of General Terms
Sixth graders find the recurrence relation for simple sequences
construct tables of values for a pattern. They find the value of the general term of a sequence algebraically.
Curated OER
Graphing
Learners gather statistical information on a chosen topic and place it into a spreadsheet. Using th Excel chart wizard, students create tables, graphs and charts of their information. They interpret the data and share it with the class.
Curated OER
Skittles, Taste the Rainbow
Fifth graders learn and then demonstrate their knowledge of a bar and a circle graph using the classroom data. Students are given a pack of skittles candy. Students create a bar and circle graph indicating the results of the contents of...
Illinois State Board of Education
Common Core Teaching and Learning Strategies
Here's a resource that deserves a place in your curriculum library, whether or not your school has adopted the Common Core. Designed for middle and high school language arts classes, the packet is packed with teaching tips, materials,...
Serendip
Is Yeast Alive?
Through two investigations, life science learners determine whether or not yeast is alive. They perform tests for metabolism by providing sugar and observing if gas is produced as a byproduct. They incubate some of the sample for at...
Illuminations
Circumference and Areas of Circles
Middle and high schoolers listen to a scenario about a puppy and use the scenario to develop formulas in order to find the area of a circle. In this circumference lesson, pupils understand how to find the radius, diameter, area of a...
Curated OER
Comparing School Bus Stats
Engage in a lesson plan that is about the use of statistics to examine the number of school buses used in particular states. They perform the research and record the data on the appropriate type of graph. Then they solve related word...
Curated OER
What Can I Afford?
Students explore the concept of cell phone plans. In this cell phone plan lesson, students research the cost of cell phones. Students compare various cell phone plans and decide on which phone plan is best for them.
Curated OER
States of Matter
Students study the states of matter. In this matter lesson plan, students use dry ice to study the states of matter. Students observe and answer questions based on the material.
Curated OER
??Discovering Patterns and Trends of the Periodic Table using PDAs??
In this lesson, 10th graders research the elements within a particular period of the periodic table of elements. Students gather data from PDA for each element and join other individuals to decpher the patterns in the peridoc table.
Curated OER
Table Mazes Using Microsoft Word
Students create a table and use word processing functions to design a maze. They use the table feature of Microsoft Word to construct a solvable maze and incorporate clip art and Word Art into their mazes. They use Word Art to add a...
Curated OER
Function Tables
Learners practice representing problems found in the real world in terms that can be translated into mathematical expressions. The situations are represented in tables and graphs by students.
Curated OER
Interpreting and creating tables
Pupils observe examples and discuss how to interpret them. They then
brainstorm examples of possible questions students could use to create a table. They take time to formulate a question and collect data.
Other popular searches
- Using Table of Contents
- Table of Contents Index
- Table of Contents Sheets
- Table of Contents Worksheets
- Using a Table of Contents
- Table of Contents and Index
- Table of Contents Learning
- Table of Contents Lessons
- Using the Table of Contents
- Table of Contents, Headings


