Curated OER
Data Handling: Tally Chart on Illnesses
In this tally chart worksheet, students analyze a chart showing childhood illness cases. Students use the tally chart to solve 6 problems.
Curated OER
Solving Inequalities
In this solving inequalities worksheet, 9th graders solve and complete 10 different problems that include various inequalities. First, they add any positive or negative number to both sides of the sign. Then, students multiply or divide...
Curated OER
Problem-Solving Strategy: Find a Pattern: Problem-Solving
In this finding patterns learning exercise, students read the word problem about costume costs and study the graph. Students then follow the steps of understand, plan, solve, and look back to find the pattern.
Curated OER
Addition to Solve System of Linear Equations
For this algebra worksheet, students solve system systems of equation. They use addition to solve the problems. There are 6 questions with an answer key.
Curated OER
Solving Polynomial Equations
Students demonstrate how to use spreadsheets as a tool for analyzing, visualizing and solving mathematical problems. Students obtain fundamental grasp of cubic equations and other polynomial equations.
Curated OER
Graphing Polar Equations
In this graphing polar equations activity, students solve and complete 10 various types of problems. First, they construct a table of values using the special angles and their multiples. Then, students plot the points in the table on a...
Curated OER
The Koch Snowflake: Measuring and Area
In this snowflakes worksheet, students cut out the given snowflakes and place them on graph paper to solve problems such as area and measurement. Students do this for 6 snowflakes.
Curated OER
Linear & Quadratic Functions: Solving Graphically
In this linear and quadratic function worksheet, students examine and solve a system of equations. They graph each function on a coordinate plane. This one-page worksheet contains ten problems.
Curated OER
Computer Graphing
Students research the Internet or create surveys to find graphable data. They collect, organize, analyze and interpret the data. Finally, they choose the appropriate type of graph to display the data and find the measures of central...
Curated OER
Average Value of Functions
In this integrals and average value worksheet, students problem solve thirty equations or word problems involving average value of functions, volume and integrals.
Curated OER
Graphs, Equations and Inequalities
In this inequalities worksheet, 6th graders solve and complete 30 various types of problems. First, they calculate and write down a whole number for each equation. Then, students determine the gradient of a line with a given equation....
Curated OER
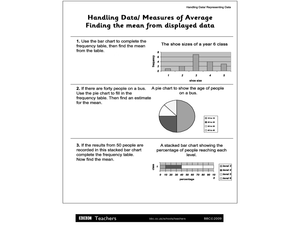
Handling Data/Measures of Average - Finding the Mean from Displayed Data
In this mean and average instructional activity, students use the bars and charts to help them find the means using the given data. Students solve 3 problems.
Curated OER
Chart problems involving car defects and customer service departments
In this interactive activity, students solve two problems using the charts provided. Students must convey they are able to understand charts and how to read them.
Curated OER
Rational Function Graphs
Students use algebraic methods to represent and solve problems. Using a graphing calculator, students solve rational and inequality problems. They visually demonstrate solutions of functions through graphing. Students answer questions...
Curated OER
Meatiest States: Graph Problem Solving
For this graph problem solving worksheet, students analyze a graph that shows commercial red meat production in five states. Students answer 5 word problems using the data on the graph.
Curated OER
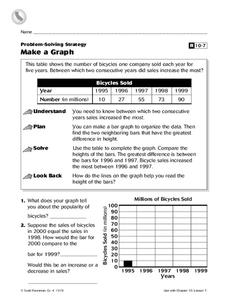
Make a Graph
In this graphs instructional activity, 4th graders, after studying and analyzing a table on bicycles sold within several years, answer 2 short answer questions relating to the table.
Curated OER
Graph Groups
In this mathematics worksheet, students solve a number of problems by counting each shape and graphing the amount to the right in height. Then they circle the shape that appears the most often on the sheet.
Curated OER
Problem-Solving Strategies in Word Problems
Students examine how to determine which strategy to use to solve word problems. In this word problem strategy lesson, students listen to a lecture on the process of using different strategies to solve math problems. They look at guess...
California Education Partners
T Shirts
Which deal is best? Learners determine which of two companies has the best deal for a particular number of shirts. They begin by creating a table and equations containing each company's pricing structure. Individuals finish the seventh...
Inside Mathematics
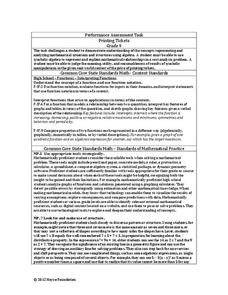
Printing Tickets
Determine the better deal. Pupils write the equation for the cost of printing tickets from different printers. They compare the costs graphically and algebraicaly to determine which printer has the best deal based upon the quantity of...
EngageNY
Ferris Wheels—Using Trigonometric Functions to Model Cyclical Behavior
Have class members going in circles as they model the path of a Ferris Wheel using trigonometric functions. Building on the previous lesson in this series on transformations, learners use trigonometric functions to model wheels of...
EngageNY
Tides, Sound Waves, and Stock Markets
Help pupils see the world through the eyes of a mathematician. As they examine tide patterns, sound waves, and stock market patterns using trigonometric functions, learners create scatter plots and write best-fit functions.
EngageNY
Characteristics of Parallel Lines
Systems of parallel lines have no solution. Pupils work examples to discover that lines with the same slope and different y-intercepts are parallel. The 27th segment of 33 uses this discovery to develop a proof, and the class determines...
Balanced Assessment
Vacation in Bramilia
This performance task gives the population model of different types of flies and asks scholars to analyze the two populations. After interpreting the functions individually, participants compare the two populations and find the time when...


