Hi, what do you want to do?
Texas Instruments
Texas Instruments: Sands of Time
In this activity, students can use a graphing calculator to find a regression equation and then interpolate the data from the equation using integration. They will explore the length of day during the winter and summer solstice at...
Illustrative Mathematics
Illustrative Mathematics: 8.sp Laptop Battery Charge
This task looks at how long it takes for a laptop battery to fully charge. Students make a scatter plot of data, draw a 'line of best fit,' and predict the time it will take to reach a full charge. Aligns with 8.SP.A.2.
Texas Instruments
Texas Instruments: Exponential Models and Logarithmic Scales
In this activity, students will analyze exponential growth data and then switch to a logarithmic scale. Includes both an exponential and a linear regression on the data, and asks students to make connections between two forms of...
Texas Instruments
Texas Instruments: Numb3 Rs: Less Is More
Based off of the hit television show NUMB3RS, this two-part lesson begins by having students try to find the line of best fit for a given set of data (strike outs vs. home runs). The second part of the lesson shows how least squares...
Texas Instruments
Texas Instruments: Burning Volumes
An analysis of how the volume of various jars impacts the burning time of candles. Data collected will be used to explore modeling, line fitting and linear regression Using graphing calculators.
Texas Instruments
Texas Instruments: Women's 5000 M World Record Progression: Median Median Line
In this activity, students will collect the Women's 5000 meter progression of world record data and find the median - median line and the linear regression for the data. They will investigate the appropriateness of each of the models.
Texas Instruments
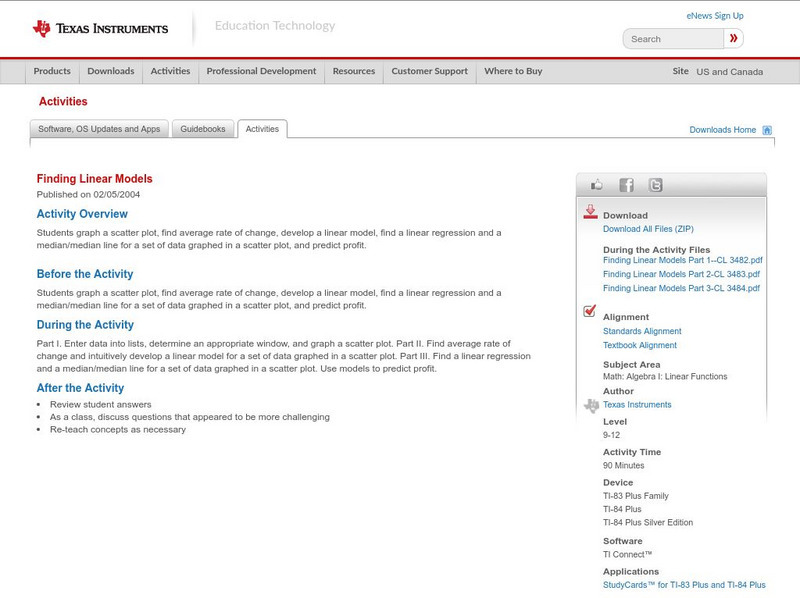
Texas Instruments: Finding Linear Models
Students graph a scatter plot, find average rate of change, develop a linear model, find a linear regression and a median/median line for a set of data graphed in a scatter plot and predict profit.
Texas Instruments
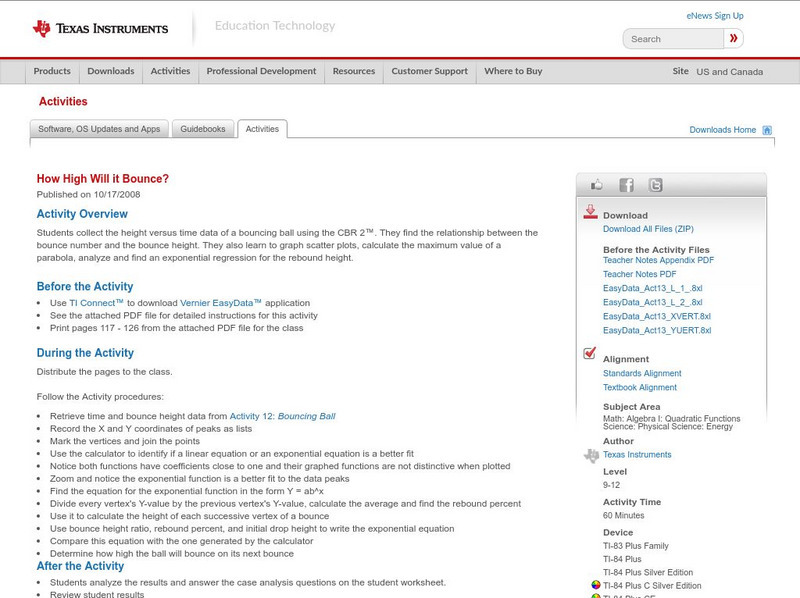
Texas Instruments: How High Will It Bounce?
In this activity, students collect the height versus time data of a bouncing ball using the CBR 2. They find the relationship between the bounce number and the bounce height. They learn to graph scatter plots, calculate the maximum value...
National Council of Teachers of Mathematics
Nctm: Illuminations: Line of Best Fit
Use this applet to learn about a line of best fit for a set of data points. Some example data in this site include statistics from the 2004-2005 LA Lakers season. Students can guess the equation for a set of data points before the applet...
Texas Instruments
Texas Instruments: Numb3 Rs: Dialing Ben
Based off of the hit television show NUMB3RS, this lesson has students try to discover if there has been a significant change in cell phone use over the course of ten days. If so, this "change point" can be detected by creating a line of...
Purple Math
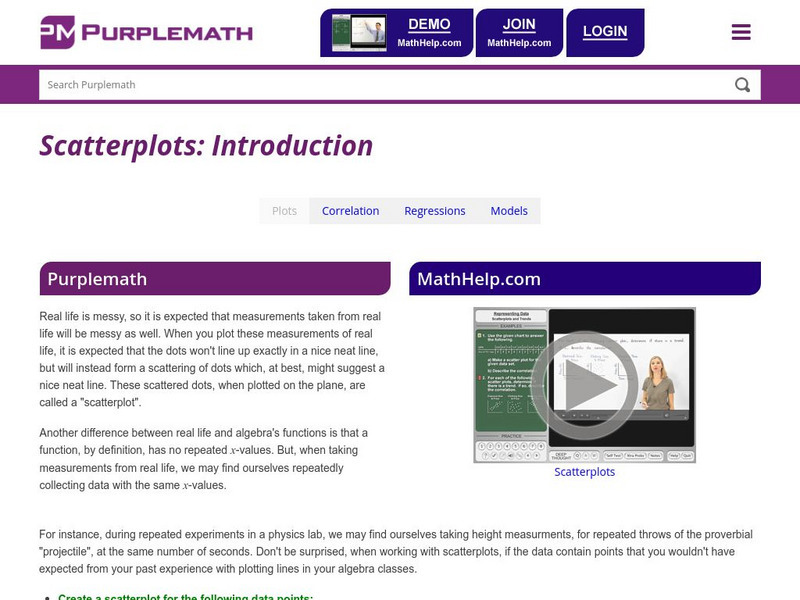
Purplemath: Scatterplots and Regressions
Explains the purpose of scatterplots, and demonstrates how to draw them.
Other
Stat Soft: Statistics Glossary
Dozens of statistical terms are defined and illustrated in this glossary.
Khan Academy
Khan Academy: Fitting Quadratic and Exponential Functions to Scatter Plots
Determine if a quadratic or exponential model fits a data set better, then use the model to make a prediction. Students receive immediate feedback and have the opportunity to try questions repeatedly, watch a video or receive hints.
Missouri State University
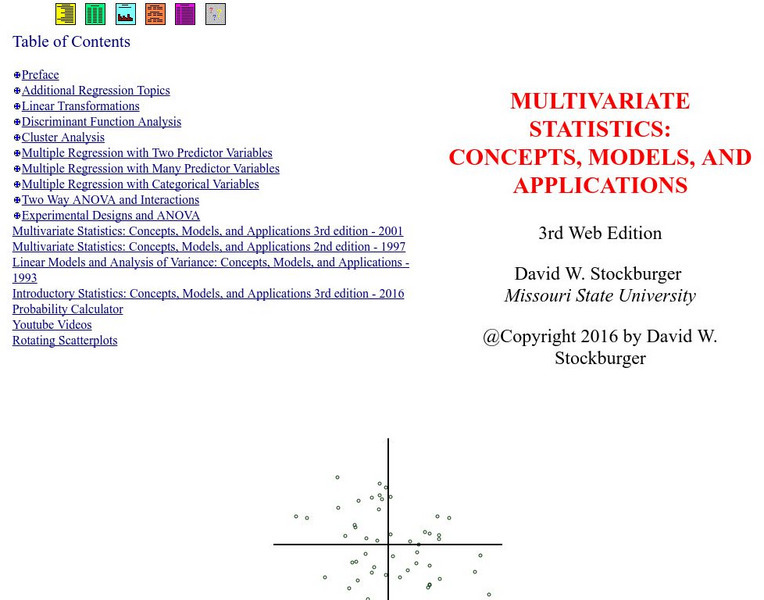
Missouri State U.: Multivariate Statistics: Concepts, Models, and Applications
This site features an online textbook with very in-depth information about multivariable statistics. (NOTE: In the archived version, some images do not appear. However, many of them are multiple-choice questions for students, and if you...
Texas Instruments
Texas Instruments: Numb3 Rs: Exponential Modeling
Based off of the hit television show NUMB3RS, this lesson introduces students to exponential equations, their graphs, and their application in the real world. The lesson is framed in the context of the number of cell phone users for a...
Texas Instruments
Texas Instruments: Numb3 Rs: Magnetism
Based off of the hit television show NUMB3RS, this lesson, designed for upper-level high school students, has students linearize the data describing the force of a magnet at various distances. While it is assumed students already know...
Texas Instruments
Texas Instruments: Non Linear Association I
This set contains statistics questions regarding non-linear association: straightening data using logarithmic and power transformations. The student analyzes which type of regression will best model the data.
Texas Instruments
Texas Instruments: Let's Play Ball With Families of Graphs
This activity is designed for students to use real-time data to generate a family of parabolic graphs. The data set will be generated by graphing the heights of a ball bounce with respect to time. Students will determine the regression...
Texas Instruments
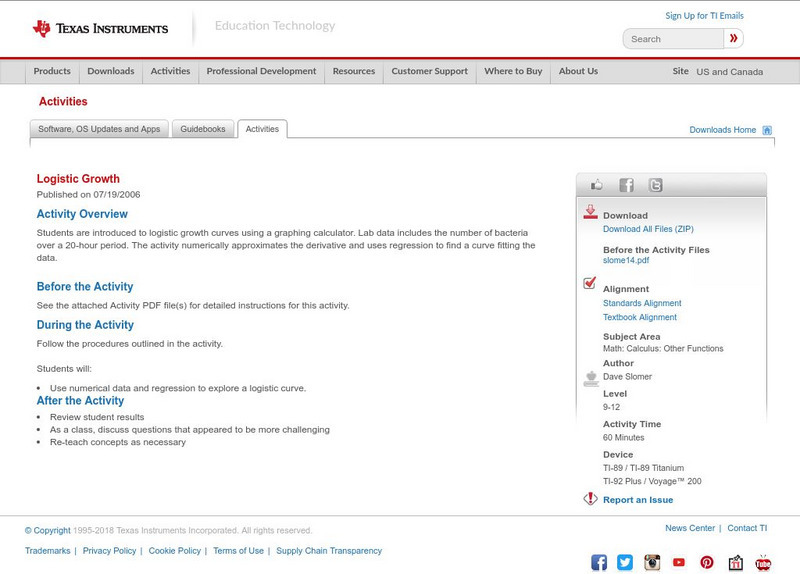
Texas Instruments: Logistic Growth
Students are introduced to logistic growth curves using a graphing calculator. Lab data includes the number of bacteria over a 20-hour period. The activity numerically approximates the derivative and uses regression to find a curve...
Khan Academy
Khan Academy: Introduction to Residuals
Build a basic understanding of what a residual is.
Texas Instruments
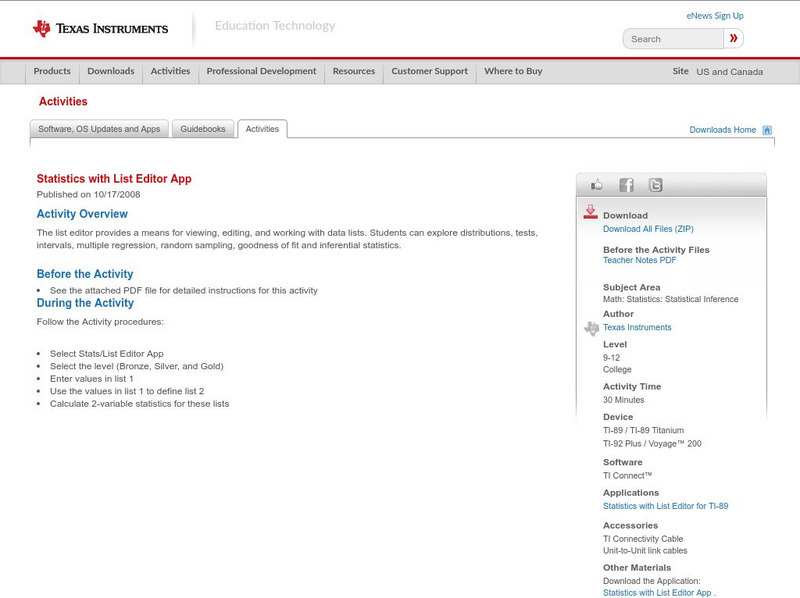
Texas Instruments: Statistics With List Editor App
The list editor provides a means for viewing, editing, and working with data lists. Students can explore distributions, tests, intervals, multiple regression, random sampling, goodness of fit and inferential statistics.
Texas Instruments
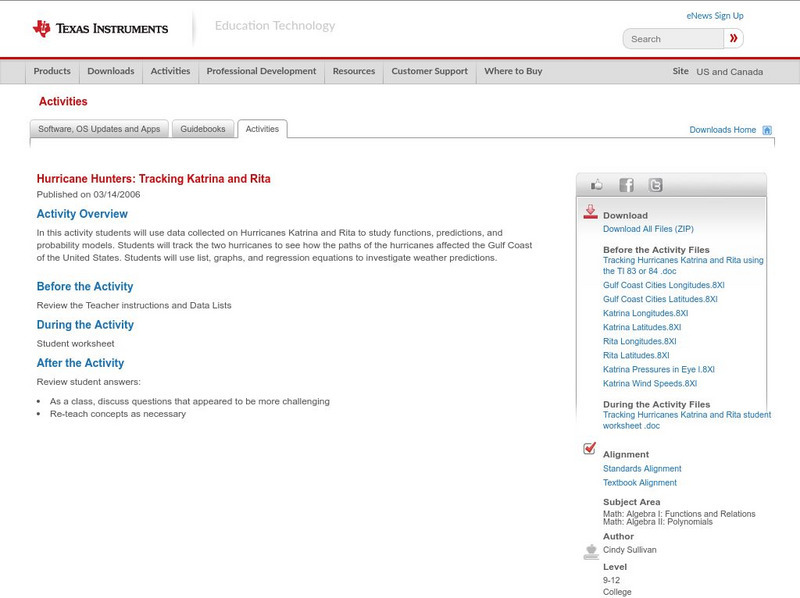
Texas Instruments: Hurricane Hunters: Tracking Katrina and Rita
In this activity students can use data collected on Hurricanes Katrina and Rita to study functions, predictions, and probability models. Students will track the two hurricanes to see how the paths of the hurricanes affected the Gulf...
Texas Instruments
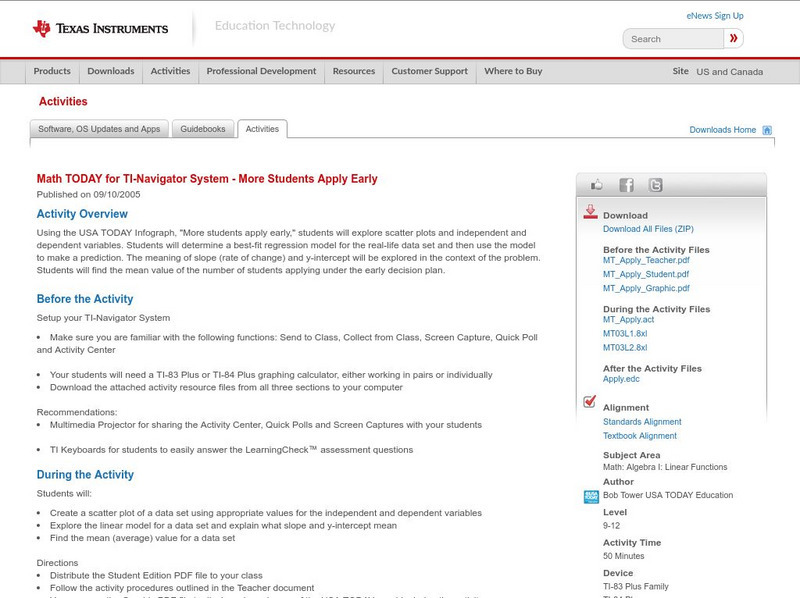
Texas Instruments: Math Today for Ti Navigator System: More Students Apply Early
Using the USA TODAY Infograph, "More students apply early," students will explore scatter plots and independent and dependent variables. Students will determine a best-fit regression model for the real-life data set and then use the...
Wolfram Research
Wolfram Math World: Probability and Statistics
This is a resource for many topics in probability and statistics. Click on the topic of your choice for an explanation. The sites you will be linked to are quite extensive. A degree of higher-level math is necessary for understanding...


