Curated OER
Graphs! Graphs! Graphs!
Students practice making charts and graphs from data on spreadsheets. Individually, they create a graph representing the latest information on voter registration. They answer questions and analyze the data to end the lesson plan.
Curated OER
Graphing Temperatures
Students identify current temperatures for different regions of the United States. Using current information, they develop hypothesis for the temperature in the same region tomorrow. They use the Weather Channel website to find actual...
Curated OER
Memorial Day: Graphing Our History of Sacrifice
Students examine the significance of Memorial Day. They analyze data, conduct Internet research, create a graph using an online graphing tool, and take a quiz.
Curated OER
Graph It with Coffee!
Students interview employers and employees at local coffee shops about sales and profits and create graphs comparing and contrasting information obtained about the businesses.
Curated OER
What is Your Favorite Christmas Light Color? Bar Graph Recording Sheet
In this opinion bar graph worksheet, students receive a number and record their preference of Christmas light color in the worksheet. They examine the colored boxes at the bottom of the page to make their choice. There are no directions...
Curated OER
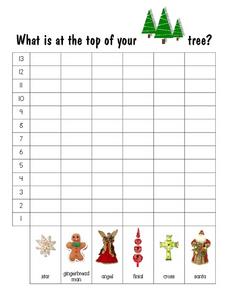
What Is At the Top of Your Christmas Tree? Bar Graph Recording Sheet
In this Christmas bar graph recording worksheet, students receive a number and record what is placed at the top of their Christmas tree. They chose between a star, a gingerbread man, an angel, a finial, a cross or a Santa figure. There...
Curated OER
Graphing Macroeconomic Theories
Review macroeconomic theories and graphing using this resource. Learners analyze a diagram illustrating various supply curves, and then complete fill in the blank questions.
Curated OER
Immigration and American Life Graphing Immigration Data
Students practice graphing immigration data from the Caribbean. After practicing making their own graphs, they make the final graph and label it accordingly. They work together to determine the six most populated states of immigrants...
Curated OER
St. Patrick's Day Lucky Charms Sort Bar Graph
In this elementary data collection and graphing worksheet, students paste the correct cereal pieces to match the words at the bottom of the bar graph. They count the items and fill in the graph in this St. Patrick's Day themed activity.
Curated OER
Reading Immigration Graphs and Charts
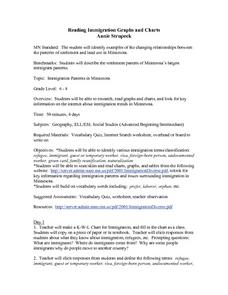
Students examine the settlement patterns and land use in Minnesota. In groups, they practice reading immigration graphs and charts and discuss why immigrants settled where they did. They are also introduced to new vocabulary related to...
Curated OER
Making Graphs
Young scholars explore statistics by conducting class demographic surveys. In this graph making lesson, students identify the family members of each classmate, pets they own, and favorite activities. Young scholars organize their...
Curated OER
Halloween Graph Paper
In this Halloween graphing learning exercise, 5th graders enhance their math skills by using the graph to help them collect and organize data.
Curated OER
Your Tax Dollars at Work
In order to understand how tax dollars are spent, young economists use given data and graph it on a circle graph. Circle graphs are highly visual and can help individuals describe data. A class discussion follows the initial activity.
Curated OER
Tides at the Battery, NY
Skill in using Excel and increasing proficiency in manipulating data are challenged with this data analysis work. A web link supplies data and step-by-step instructions help learners create a graph. There are many extension activities...
Curated OER
The Gathering and Analysis of Data
Young mathematicians gather data on a topic, graph it in various forms, interpret the information, and write a summary of the data. They present their data and graphs to the class.
Curated OER
Race, Education, and Income: Comparing Carter & Reagan
High school learners compare economic outcomes for 3 racial groups under the presidencies of Jimmy Carter and Ronald Reagan by analyzing a series of graphs, answering questions from a worksheet, and participating in a discussion.
Curated OER
Determining the Existence of Gender Bias in Daily Tasks
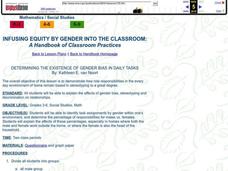
Help your kids explore gender bias. Learners design and conduct a survey examining role responsibilities within families. They determine the percentage of responsibilities for males vs. females and graph the results. Then they analyze...
School Improvement in Maryland
Demographic Investigation
What are the factors that influence voting patterns? How do these factors influence government funding? Is participation the squeaky wheel gets the grease? Class members interpret graphs and analyze trends to determine what demographic...
Museum of Tolerance
Why is This True?
Are wages based on race? On gender? Class members research wages for workers according to race and gender, create graphs and charts of their data, and compute differences by percentages. They then share their findings with adults and...
Yummy Math
A Cardioid for Valentine’s Day
It's Valentine's Day in geometry class! Celebrate the day of love with a heart-themed activity in which young mathematicians create a cardioid on polar graph paper.
Curated OER
Tallest Waterfalls of the World: Graph It
In this graphing worksheet, 6th graders graph the tallest waterfalls of the world according to which region they are located in. Students then answer questions related to their graph information.
Curated OER
Canadian Social Trends
Young scholars use surveys to explore how to design graphs, tables, and diagrams. They discuss articles which can stimulate ideas for research topics, or surveys of their own.
Wise Owl Factory
Happy Father's Day
Celebrate Father's Day this year with a fun math and coloring activity! After counting all of the dad-related pictures and graphing their frequency, learners color a Father's Day card to give to their dads.
Other popular searches
- Coordinate Graphing Pictures
- Graphing Ordered Pairs
- Graphing Skills Lesson Plans
- Coordinate Graphing
- Graphing Linear Equations
- Holiday Coordinate Graphing
- Graphing Linear Inequalities
- Graphing Calculator
- Graphing Inequalities
- Halloween Math Graphing
- Graphing Mean, Median, Mode
- Graphing Data


