Curated OER
Unit IV: Worksheet 3 - Free Particle
On this homework assignment, physics novices draw force diagrams and compute the tension in various situations. Drawings help learners visualize each of six scenarios. This is terrific practice in solving problems with forces.
Curated OER
Color-Coded Sentence Diagrams
Students read Ruth Heller's books and learn to identify various parts of speech. They label words according to the parts of speech and use the words to form simple and then more complex sentences. Afterward, they analyze sentences and...
Science Geek
Phase Changes
Examine the energy transfer of phase changes through diagrams. The second slide show in a series of seven presents the information related to energy and phase changes. It includes the effect of pressure on phase changes.
Sports Diagrams
NCAA Basketball Halfcourt Diagram
Look no further for the classic half court diagram you've been looking for to lead your basketball practice. Consider adding a snapshot of this document to a presentation, and projecting the image onto a whiteboard for convenient and...
Curated OER
Delicious Diagrams
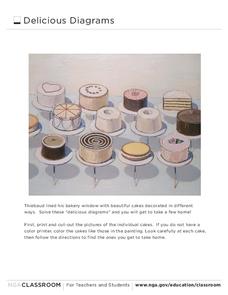
For this math worksheet, students cut out pictures of twelve different cakes. Students use the pictures to complete four venn diagrams- half of them that compare two characteristics and the other that compare three.
Curated OER
Christmas in Other Countries: A Venn Diagramming Activity
Students diagram similarities and differences in Christmas celebrations around the world, and compare and contrast their celebration of Christmas with the celebrations of others.
Curated OER
Venn Diagrams
Students collect and display data in a Venn Diagram. In this statistics lesson, students collect data, compare the data and make inferences about their data. They use the Venn diagrams to identify what the data have in common and how...
Curated OER
Teaching Neuro-anatomy Through Schematic Diagrams
Students develop a deeper understanding of the brain. For this neuro-anatomyl lesson plan, students will use simple diagrams to understand the brain and will progress to more complex diagrams as they gain understanding.
Curated OER
Using Venn Diagrams to Compare Two Ecosystems
Students explore the distribution of two ecosystems on a global scale; and map the distribution of tropical and temperate rain forests throughout the world. They use a Venn Diagram to describe these ecosystems and the differences between...
Curated OER
Venn Diagram: Beatrix Potter Books
In this using a Venn Diagram worksheet, students read two Beatrix Potter books and summarize their differences and similarities on the Venn Diagram. Students answer 3 questions.
Curated OER
Comparing Modern American and Ancient Egyptians (Venn Diagram)
In this comparison worksheet, students explore the cultures of both the modern Americans and the ancient Egyptians. Students compare and contrast these two sets of cultures using a Venn diagram. Students list characteristics in the Venn...
Curated OER
Venn Diagram
In this science related worksheet, students research animals that are nocturnal (night animals) and diurnal (day animals) and place them in a Venn diagram. Students write characteristics about these animals that are alike, different and...
Curated OER
Comparing Animals and Plants Venn Diagram
In this comparing 2 items worksheet, students construct a Venn diagram involving the comparison of animals and plants and what they have in common.
EngageNY
From Ratio Tables to Double Number Line Diagrams
How much sugar is in one bottle? Pupils use double number line diagrams to determine the amount of sugar in a 1L bottle of cola. The teacher leads a discussion on ways that double number lines can be of assistance in solving a problem...
Curated OER
Using Details from the Text
Explore non-fiction comprehension strategies with your class. They will visualize daily activities and label a 4 circle Venn diagram with related phrases. They must identify the overlapping sections as "main ideas," then complete a...
Curated OER
"The Most Dangerous Game" Study Guide Packet
The comprehensive study guide packet for Richard Connell’s "The Most Dangerous Game" challenges young readers to reflect on hunting as a sport and what it means to be civilized. Using various graphic organizers, including a Cornell Notes...
Curated OER
Reading Venn Diagrams
Venn diagrams are useful in so many ways. The class views a worksheet to assist them in understanding how to compare two items based on similarities and differences. Children compare four different items using partially completed Venn...
Curated OER
Venn Diagrams: Write the Expression
In this Venn diagrams learning exercise, students write the expression that best suits the Venn diagrams. Students complete 4 problems total.
Curated OER
Comparing Authors (Venn Diagram)
Need a template for a Venn diagram? This one is designed to show the similarities and differences between two authors. Although no explanations are included, the graphic is self-evident.
Curated OER
Graphic Organizer: Venn Diagram for Briar Rose
Compare and contrast the characters of Gemma and Becca from Briar Rose. Using a Venn diagram (not included but easy to create), readers will explore the characters. Not much direction or explanation is included here.
Curated OER
Scatter Diagrams and Curve Fitting
In this Scatter Diagrams and Curve Fitting worksheet, students are guided in how to graph a scatter diagram (plot) and a Best Fit Line using a TI-83 graphing calculator.
Curated OER
Writing Short Stories Using a Plot Diagram
Students read Abe Lincoln's Hat and use a plot diagram to identify the sequence of the story. They use plot diagrams to write their own stories from the perspective of Abraham Lincoln's hat.
Physics Classroom
Motion Diagrams
Scholars work through three activities building motion diagrams as part of a series exploring dimensional kinematics. Each activity has six descriptions requiring application of velocity vectors, acceleration vectors, and challenge...
National Science Teachers Association
Hop into Action
Young scientists find out what makes amphibians such unique and interesting animals in this simple life science lesson. After looking at pictures and discussing the characteristics of amphibians, learners complete a series of three Venn...
Other popular searches
- Sets and Venn Diagrams
- Venn Diagrams
- Water Cycle Diagram
- Human Body Systems Diagram
- Tree Diagram
- Respiratory System Diagram
- Circulatory System Diagram
- Plot Diagram
- Human Skeleton Diagram
- Diagram Sentences
- Blank Venn Diagram
- Venn Diagram Math Problems


