Scholastic
Study Jams! Tree Diagrams
With so many toppings to chose from, make the ice cream truck combinations a fun math problem that teaches your learners about outcomes. The video introduces a tree diagram that allows your mathematicians to see how to create...
Curated OER
Venn Diagrams
The Venn diagram is such a useful tool! It can be used to provide a visual when comparing things across the curriculum. In this case, learners consider three Venn diagrams that each have a unique set of things in them. They must answer...
EngageNY
Events and Venn Diagrams
Time for statistics and learning to overlap! Learners examine Venn Diagrams as a means to organize data. They then use the diagrams to calculate simple and compound probabilities.
EngageNY
Using Tree Diagrams to Represent a Sample Space and to Calculate Probabilities
Cultivate the tree of knowledge using diagrams with two stages. Pupils create small tree diagrams to determine the sample space in compound probability problems. The lesson uses only two decision points to introduce tree diagrams.
Curated OER
Venn Diagrams
The Venn diagram is an important graphic organizer, and learners should be familiar with it. Here, pupils compare things that are made of plastic and metal, and they identify the things that have both substances in them. There are two...
Curated OER
Venn Diagram
In this Venn Diagram worksheet, students read a description of a venn diagram and why they are used. Students choose two things to compare and fill in a venn diagram about their similarities and differences.
Curated OER
Venn Diagrams, Part 3
Can your first graders interpret Venn diagrams? Different sets of clues help pupils narrow down a specific number in different shapes. They determine odds and evens, greater than or less than, and what shape the number is in. A fun...
Corbett Maths
Tree Diagrams
Climb out on a branch to find probabilities. Using tree diagrams, the resource shows how to find compound probabilities when the events are not uniform. The video works through two different scenarios, one where the probabilities remain...
Curated OER
Problem Solving: Draw a Diagram
This problem solving PowerPoint presents a detailed, logical sequence of steps to follow in order to solve a story problem. The thinking processes described are given in text and represented by a visual model. After discussing the...
Primary Resources
Venn Diagrams
Combine your lessons on Venn diagrams, probability, and multiples with several activities. After picking seven cubes, learners note the number of cubes that are blue and mark them in a Venn diagram. The next assignments prompt them to do...
Mathed Up!
Stem and Leaf Diagrams
Order the data within a stem-and-leaf display. Pupils take data and create and ordered stem-and-leaf diagrams, including the key. Participants take their data and determine answers about the information. Class members then find measures...
Mathed Up!
Tree Diagrams
Explore how to visually represent probability problems. Scholars watch a video to refresh their memories on tree diagrams. To finish the activity, they complete a worksheet of questions on this topic.
Curated OER
Mastering Math Vocabulary of Prime and Composite Numbers Using Venn Diagrams
Create Venn diagrams. Your class will discover the relationships between even and prime numbers. Next, they will compare that to the relationship between odd and composite numbers.
Curated OER
Color and Compare: Venn Diagram
In this color and compare worksheet, students will color two different snowmen and use a Venn diagram to compare and contrast their similarities and differences.
Curated OER
Problem-Solving Strategy: Draw a Diagram - Problem Solving 11.3
In this drawing a diagram to solve word problems learning exercise, students practice the understand, plan, solve, and check technique for solving word problems by drawing diagrams. Students solve two word problems.
Willow Tree
Histograms and Venn Diagrams
There are many different options for graphing data, which can be overwhelming even for experienced mathematcians. This time, the focus is on histograms and Venn diagrams that highlight the frequency of a range of data and overlap of...
Curated OER
Problem Solving - Draw a Diagram
There is an excellent strategy for learners to use when faced with a word problem that uses fractions. This presentation shows how to draw a diagram of the fractions in the problem in order to get a visual representation. Although brief,...
Curated OER
Place the Numbers on the Venn Diagram
In this middle school mathematics worksheet, students use a Venn diagram to sort a group of numbers into multiples of 2 or 3, or both. The one page worksheet contains one problem with answer.
CK-12 Foundation
Venn Diagrams: Planets and Dwarf Planets of the Solar System
Yes, Venn diagrams are helpful in science, too. Learners use an interactive to classify celestial bodies as having moons, as dwarf plants, as both, or as neither. They answer a set of challenge questions based on the Venn diagrams they...
CK-12 Foundation
Venn Diagrams: T-Shirt Mystery
Sorting your t-shirts is easy with Venn diagrams. Individuals use a drag and drop interactive to classify shapes on t-shirts into Venn diagrams. A set of challenge questions tests whether the classification is correct.
K-5 Math Teaching Resources
Venn Diagram Template
Looking to compare and contrast three things? Look no further! Use this Venn diagram template by simply printing and copying as many as you need.
Curated OER
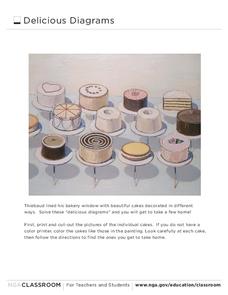
Delicious Diagrams
For this math worksheet, students cut out pictures of twelve different cakes. Students use the pictures to complete four venn diagrams- half of them that compare two characteristics and the other that compare three.
Curated OER
Venn Diagrams
Students collect and display data in a Venn Diagram. In this statistics lesson, students collect data, compare the data and make inferences about their data. They use the Venn diagrams to identify what the data have in common and how...
EngageNY
From Ratio Tables to Double Number Line Diagrams
How much sugar is in one bottle? Pupils use double number line diagrams to determine the amount of sugar in a 1L bottle of cola. The teacher leads a discussion on ways that double number lines can be of assistance in solving a problem...
Other popular searches
- Sets and Venn Diagrams
- Venn Diagrams
- Water Cycle Diagram
- Human Body Systems Diagram
- Tree Diagram
- Respiratory System Diagram
- Circulatory System Diagram
- Plot Diagram
- Human Skeleton Diagram
- Diagram Sentences
- Blank Venn Diagram
- Venn Diagram Math Problems


