School Improvement in Maryland
Pollution Data
Smog? Vog? What is being done about air pollution? Government classes investigate federal and state programs designed to improve air quality, and then develop a proposal for further actions that are needed.
University of Richmond
Renewing Inequality: Family Displacements through Urban Renewal 1950-1966
What is progress? Who bears its cost? High schoolers consider the questions as they review data on families displaced by urban renewal projects in the 1950s and 1960s. An interactive, curated data project asks historians to consider the...
University of Richmond
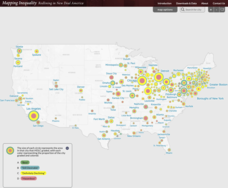
Mapping Inequality: Redlining in New Deal America 1935-1940
Redlining—or the practice of racial discrimination in housing loans—directly led to today's segregated living patterns in America. Using data from the federal Home Owners' Loan Corporation, classmates visualize the impact of policy on...
Albert Shanker Institute
Economic Causes of the March on Washington
Money can't buy happiness, but it can put food on the table and pay the bills. The first of a five-lesson unit teaches pupils about the unemployment rate in 1963 and its relationship with the March on Washington. They learn how to create...
Curated OER
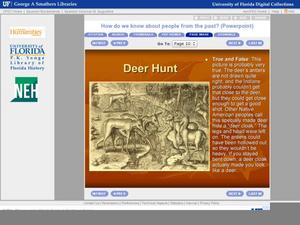
How Do We Know About People From The Past?
It's not enough to see or just read a primary source document; one has to analyze them fully to understand their historical implications. First learners are introduced to what primary and secondary sources are, then they read a bit of...
Curated OER
Tides at the Battery, NY
Skill in using Excel and increasing proficiency in manipulating data are challenged with this data analysis work. A web link supplies data and step-by-step instructions help learners create a graph. There are many extension activities...
Curated OER
Historical Population Changes in the US
Students conduct research on historical population changes in the U.S. They conduct Internet research on the Historical Census Data Browser, create a bar graph and data table using a spreadsheet program, and display and interpret their...
Curated OER
Wind Effects- A Case Study
Learners explore hurricanes. For this weather data interpretation lesson, students draw conclusions about the impact of Hurricane Floyd as it related to weather conditions. Learners read and interpret a tide data table, a barometric...
Curated OER
Using Bar Graphs to Understand Voting Patterns
Bar graphs are used as a way to study voting patterns in the United States. A variety of statistical data is presented in the graphs, and pupils must interpret the data in order to make a report to the class. Three excellent graphs,...
Curated OER
Understanding the 1855 Census Database
Use data from the 1855 New York census to better understand the Irish immigrant experience during the late 19th century. Young historians analyze information from the census and build three hypotheses regarding the residents of the Five...
John F. Kennedy Presidential Library & Museum
Red States/Blue States: Mapping the Presidential Election
Young historians investigate how voting patterns have changed by comparing the outcome of the 1960 election to the outcome of the recent election. A creative final assessment has participants making a news show wherein they provide...
C-SPAN
Why Do Americans Not Vote in Elections?
In an age of inflamed politics, who votes, who doesn't vote, and why are the questions everyone is trying to answer. Pupils listen to scholars, journalists and data crunchers on voting statistics to make their own conclusions. A chart...
American Psychological Association
A Tasty Sample(r): Teaching about Sampling Using M&M’s
Here's a sweet activity! As part of a study of psychological research methods and statistic gathering, individuals develop a hypothesis about the number of each color of M&Ms in a fun-size package. They then count the number of each...
Curated OER
Remembering Our Veterans
Eighth graders research a variety of military statistics while using the theme of Remebering Our Veterans. They use data management to plan and create a PowerPoint presentation with their findings. They incorporate different types of...
Curated OER
Projections and the Census
Students learn why the census makes a difference. In this U.S. Census lesson plan, students connect data and history in their study of previous population booms and analyze census data in order to make predictions about the future.
Curated OER
Multiplying Matrices for Fun and Profit
Learners explore matrix multiplication to generate new data. In this pre-algebra lesson, students solve problems by computing with matrices. Learners explore the concept of matrices in the real-world context of running an ice cream store.
Curated OER
Graphing the Past Using Today's Technology
Eighth graders research statistical data regarding their current social studies unit. They write questions about the measures of central tendency, collect and analyze the data, insert the data into a spreadsheet, and generate graphs.
Curated OER
Create Your Own Form
Students gather and organize data using a mock census form, and determine mean, mode, range, and median for sets of data.
Curated OER
Lessons for Atlatl Users with Some Experience-Grade 5
Fifth graders throw darts, collecting data for distance traveled. In this data analysis lesson, 5th graders throw a dart using an atlatl. They calculate the speed for each throw and determine the best dart length for distance throws.
Curated OER
Fractile vs. Equal
Students compare and contrast methods of categorizing data. In this data collection instructional activity, students complete worksheet activities that require them to note the differences between equal and fractile intervals. Students...
Curated OER
200 Years and Counting: How the U.S. Census Tracks Social Trends
Students examine the process of census taking in the United States. In this "200 Years and Counting" instructional activity, students examine the data collection process, look at an example of a census form, analyze data, and learn what...
Curated OER
You Be The Census Taker
Learners interpret information from an excerpt of the 1870 U.S. Census and compare that data to economic data they collect about local businesses in their own community. Students then evaluate how closely linked their community's economy...
Curated OER
What Did It Cost 100 Years Ago?
Students compare prices of good across the century in order to introduce the topic of inflation. They undertand the concepts of inflation and Consumer Price Index (CPI), use online calculators to figure the approximate cost of goods...
Math Drills
Valentine's Day Ordering and Comparing (A)
Youngsters use a data table to answer questions, in a Valentine's Day-themed learning exercise.
Other popular searches
- Data, Census, & Statistics
- Data Analysis Pictograph
- Data Table
- Categorical Data
- Data Analysis Lesson Plans
- Data Management
- Data Analysis Graphing
- Data Analysis and Graphs
- Science Fair Project Data
- Data Display
- Organizing Data
- Census Data


