Curated OER
Math--Pictures and Bars--Learning About Graphs
What is a graph? What does it tell us? How do you make one? These are all questions that are answered in the included packet. It's a great introduction to graphing for young learners!
Curated OER
Pies and Percentages--Learning About Pie Graphs
In this pie graph activity, students draw a pie graph for the zookeeper with the data he collected, choose a different color for each animal species and make a key to the graph.
Berkshire Museum
Camouflage!: Collecting Data and Concealing Color
Help young scholars see the important role camouflage plays in the survival of animals with a fun science lesson. Starting with an outdoor activity, children take on the role of hungry birds as they search for worms represented by...
Curated OER
Games on Echolocation
Get a little batty with life science! This fun simulation game replicates how bats use echolocation to hunt moths in their native Hawaiian habitat. After creating blind folds and discussing some basic principles of echolocation, students...
Curated OER
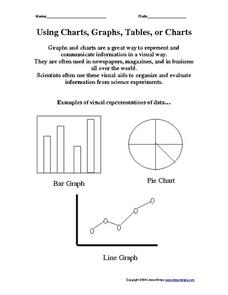
Using Charts, Graphs, Tables, or Charts
In this charts, graphs and tables activity, students view 3 different types of visual representations of data, make a list of 20 items and decide how the items can best be put together in groups to make a graph, chart or table. Students...
Curated OER
Navajo Weaving
Students explore the Navajo culture. In this Navajo Indians lesson, students gain information about their weaving and dancing. Students note the patterns in the weaving. Students create a dance that corresponds with the patterns they see...
Curated OER
Twelve Days of Christmas--Prediction, Estimation, Addition, Table and Chart
Scholars explore graphing. They will listen to and sing "The Twelve Days of Christmas" and estimate how many gifts were mentioned in the song. Then complete a data chart representing each gift given in the song. They also construct...
Curated OER
Free Printables: Easy Graphs
In this counting and charting activity, students compete the chart using either colors or the stickers provided. Teachers can determine the subject of the chart by using the activity generator.
Curated OER
Earth Energy Budget Pre Lab
Students explore energy by conducting an in class experiment. In this climate change activity, students conduct a water vapor experiment in a soda bottle. Students utilize graphs and charts to analyze the results of the experiment and...
Curated OER
"Graph It"
Young scholars work in teams to conduct short surveys of their classmates. They show their results using at least two different types of graphs.
Students separate into teams and are asked that each team to choose something that they are...
Curated OER
Songs from the Past
Students research songs from the past to learn about historical events. In this music history lesson, students conduct a survey on the Star-Spangled Banner, research the song and history on various websites, and research songs in the...
Curated OER
Poetic Math Greeting Cards
Fourth graders work in groups; collect data in a survey; depict in tables, charts, or graphs the results of the survey; and make predictions. They use creative writing skills and computer skills to generate a greeting card of their own.
Curated OER
Hot and Cold Colors
Students experiment with the color and solar energy absorption. In this color and solar energy absorption lesson, students spend two days discussing and experimenting with the concept of energy absorption. They paint cans with different...
Curated OER
Let's Go Shopping
In this fraction and pie chart worksheet, students draw a line from the toys with the prices of 50 cents, 75 cents, and 25 cents to the pie chart that show the part of a dollar the toy costs.
Curated OER
Swimmy's Friends
Students solve problems using various strategies. For this problem solving lesson, students read the book Swimmy by Leo Lionni. Students make fish swimming patterns, measure how many goldfish crackers it takes to make a handprint and...
Curated OER
Equal Parts
In this equal parts worksheet, students, working with a partner, study, formulate and calculate the answers to six word problems or drawings.
Curated OER
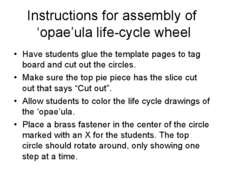
Instructions for Assembly of 'Opae" ula life-cycle wheel
Students study Opae ula. In this life cycle, art lesson, students color and cut out the printout of the life cycle of the Opae ula (red shrimp of Hawaii). They work independently to create the pie chart representing this life cycle. This...
Curated OER
Ornithology and Real World Science
Double click that mouse because you just found an amazing lesson plan! This cross-curricular Ornithology lesson plan incorporates literature, writing, reading informational text, data collection, scientific inquiry, Internet research,...
Curated OER
Technology Integration Lesson Plan: Music Database
Eighth graders gather information on fifteen of their favorite songs, create database with fields representing different attributes, explore and sort their databases, and create charts and graphs showing amount of play time vs. popularity.
Curated OER
Yummy Apples!
Students discuss apples and how they are grown. They listen as the teacher reads "Apples," by Gail Gibbons. Students discuss the story. They view several different types of apples and compare their characteristics. Students taste several...
Curated OER
Understanding Europe: A Cultural Mosaic (Theme 1)
Students discuss the cultural similarities and differences found in Northen Europe, Southern Europe, Western Europe, and Eastern Europe and create daily journal entries charting their discoveries. This lesson is the First Part in a Four...
Curated OER
Which Color Will You Pick?
Students create a spreadsheet to chart the different colors found in a package of M&M's or Skittles. They collect data, create appropriate charts, and use percentages to describe quantities.
Curated OER
Greeks Around the World: A Case Study on Greek Diaspora
Students gain an understanding of the concept of Diaspora relating to Greeks. They use guided discovery to apply the geographic inquiry model to an examination of the reasons for Greek Diaspora.
Curated OER
Publishing a Book Review
Pairs use desktop publishing software, as well as digital video and camera equipment, to craft a book review. These reviews are then shared with others in the school community through the class or school website.
Other popular searches
- Pie Charts and Graphs
- Reading Charts and Graphs
- Behavior Charts and Graphs
- Charts and Graphs Candy
- Interpret Charts and Graphs
- Charts and Graphs Christmas
- Charts and Graphs Math
- Analyzing Charts and Graphs
- Tables, Charts and Graphs
- Charts and Graphs Europe
- Using Charts and Graphs
- Bar Graphs and Charts


