Smithsonian Institution
The Vocal Blues: Created in the Deep South of the U.S.
Bring the sounds of the deep South vocal blues to the classroom with a Smithsonian Folkways lesson. In preparation, scholars listen to and count the 12 bar blues patterns in several works and identify the I, II, IV, and V chords as well...
Curated OER
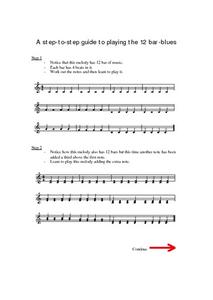
A Step-to-Step Guide to Playing the 12 Bar-Blues
For this playing the 12 bar blues music worksheet, students follow 4 steps outlined to introduce the 12 bar blues to them and then respond to 3 short answer questions.
Curated OER
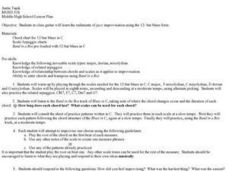
Guitar - 12 Bar Blues
Students explore the chord chart for 12-bar blues in C and then play the scales on the guitar. They play their scales at a moderate tempo and practice related arpeggios. After listening to "Band in the Box" music tracks, students...
Curated OER
Twelve-Bar Blues
Students examine blues music. In this music genres activity, students discover details about the history of the musical genre and compositional techniques. Students then compose melodies of their own with 12-bar blues chord progression.
Curated OER
Blues Improvisation
Students practice playing and improvising while playing the 12 bar blues. They practice compositional skills, evaluate and perform musical pieces focused on the blues.
Curated OER
Bar Graphs
What are these bar graphs depicting? Novice data analyzers examine two basic bar graphs and answer three comprehension questions about each. The first graph shows tickets sold per date and the next is distances run per member of a cross...
Curated OER
Simple Tally Charts and Bar Graphs
Introduce your first graders to the world of tally marks, bar graphs, and the organization of data. Pupils determine a favorite ice cream flavor based on tally marks, then use a bar graph to answer some questions about sports. There are...
Curated OER
Bar Graphs and Line Graphs
In this bar graphs and line graphs worksheet, students examine given data, organize it, and create bar graphs and line graphs from the given information. They interpret graphs and write statements explaining the graph. This one page...
Curated OER
American Music Styles: Blues - Lesson 2
Young scholars describe some of the distinguishing characteristics of blues music. They compare and analyze two versions of the same 12-bar blues song. They read and identify notation symbols for rhythm and tempo.
Curated OER
I've Got the Blues!
Young scholars identify the musical form of the 12-bar blues. They identify a problem from the "Farming in the 1940's" section and compose a 12-bar blues song. make comparisons between problems of the 1940's and today.
Curated OER
Signin' the Blues with Rock, Rap 'n Roll
Sixth graders listen to recordings and study jazz and the blues music. They identify the instrumentation and explore the 12-bar blues progression. After experimenting with different sound, 6th graders create their own arrangement, with...
Curated OER
Read and Make a Bar Graph
In this bar graph learning exercise, learners learn how to read bar graphs by using the information in each word problem and making bar graphs with the information to help solve the problems.
Curated OER
Blues Music
In this music history activity, students will read 4 paragraphs about the history of Blues. Then students will answer six questions using complete sentences.
Curated OER
Blues Music
For this blues music worksheet, students read a brief description of this genre of music and then respond to 6 short answer questions regarding the information presented in this worksheet.
Curated OER
VH1 Road to Fame: Harry Connick Jr. - Lesson 3
Students sing a vocal improvisation on a 12-bar blues progression. After watching a video on Harry Connick Jr., students try their own scat singing on the two-measure break.
Curated OER
Jazz and Math: Improvisation Permutations
Students observe that there are myriad combinations of rhythms to choose from when improvising jazz and blues music, and recognize that while the variations seem infinite, they are in fact finite. They notate a 12 bar blues progression...
Curated OER
VH1 Driven: Jamie Foxx, Lesson 3
Students examine the blues, poetry, the Harlem Renaissance, and the 12-bar blues form. They watch a segment from the video, "VH1 Driven: Jamie Foxx," participate in a class discussion, and listen to songs by Ray Charles and a poem by...
Curated OER
Bar Graphs
In this bar graphs worksheet, pupils, working with a partner, explore how to read and analyze the five answers to one mathematical bar graph.
Curated OER
Mean, Mode and Bar Graphs
In this mean, mode and bar graphs worksheet, 5th graders analyze the data given, then answer three questions about a bar graph and the data shown.
Curated OER
Tables and Graphs
Help pupils read graphs and tables with these examples and data comprehension questions. First they examine a bar graph to answer five analysis prompts. Note this graph doesn't have a label along the y-axis, so you may want to do this...
Curated OER
Introduction to the Blues
Students learn the basic elements of blues and different lyric structures.
Curated OER
Statistics Problems
In this statistics worksheet, 3rd graders answer questions about different graphs including bar graphs, picture graphs, line graphs, and more. Students complete 20 multiple choice questions.
Mathed Up!
Tallys and Charts
After watching a brief instructional video, young mathematicians are put to the test. By completing and reading frequency tables, tally charts, and bar graphs, individuals show their understanding of how to interpret data.
Teach Engineering
Bend That Bar
Bend it, but don't break it. Groups investigate the strength of different materials. Using a procedure in the seventh segment of a 22-part series on aviation, pupils determine how far a rod will bend. They determine the strength-to-mass...
Other popular searches
- 12 Bar Blues Music
- Playing the 12 Bar Blues
- Orff 12 Bar Blues
- 12 Bar Blues Lyrics
- Playing 12 Bar Blues
- 12 Bar Blues Chords
- The 12 Bar Blues
- Or Ff 12 Bar Blues


