Hi, what do you want to do?
Curated OER
Data Analysis Using Technology
Analyze data using technology. Middle schoolers design data investigations, describe data, and draw their own conclusions. Then they select the best type of graph, graph and interpret the data, and look for patterns in trends. They also...
Discovery Education
Fuss About Dust
Dust is everywhere around us; it's unavoidable. But what exactly is dust and are certain locations dustier than others? These are the questions young scholars try to answer in an interesting scientific investigation. Working...
Curated OER
College Athletes
When more basketball players are taller than field hockey players at a school, is it safe to say that in general they are always taller? The activity takes data from two college teams and your learners will be able to answer questions...
Illustrative Mathematics
Election Poll, Variation 1
Your class will learn what it means to take a random sample of a population and to draw inferences from the information gained. In part a, of the exercise, you discuss with your class how middle schoolers during a class election can be...
Illustrative Mathematics
Mr. Brigg's Class Likes Math
A quick discussion question that brings some collaboration into your classroom will allow your thinkers to make a decision about sampling. Mr. Briggs wants to know if the results from his class are a valuable comparison to the entire...
Curated OER
Random Probability
In this statistics and probability learning exercise, young statisticians solve and complete 13 different problems related to probability, percentages, and normal distributions. They consider data models, assumptions about the models,...
Curated OER
Sampling Bias And the California Recall
Using a 2002 California Gray David recall vote as an example, young statisticians identify sources of bias in samples and find ways of reducing and eliminating sampling bias. They consider ways to select random samples from a...
Curated OER
Graphing Data
Seventh graders solve and graph 10 different problems that include various questions related to data on a graph. First, they create bar graphs to display the data given. Then, pupils determine the random sample of a population listing...
Curated OER
Bringing Climate Change Into the Classroom
Students investigate the greenhouse effect and examine the potential effects of climate change in the Arctic. They construct a mini-greenhouse and test its effect on temperature, analyze historical climate statistics, and conduct an...
Illustrative Mathematics
Robot Races
Analyze data on a graph to answer three questions after a robot race. Learners practice comparing ratios and reading points on a graph. Answers may vary on the last question based on accuracy of graphing. Use the lesson along with...
Curated OER
Statistics
Seventh and eighth graders solve and complete three various types of problems. First, they find the median rate using the box-and-whisker plot shown. Then, learners describe the inter-quartile range. In addition, they determine whether...
Curated OER
Costa Rica's Sustainable Coffee
Young scholars experiment to see if birds prefer to eat bird seed with additives vs. no additives. In this experimental instructional activity students test to see if birds notice a difference between additive and no additive...
Curated OER
Data Collection
Students investigate qualitative and quantitative data. In this statistics lesson, students gather data on heights and weights of people and graph the distribution. Students discuss the differences between qualitative and quantitative data.
Curated OER
Business 90 Midterm 2: Probability
In this probability worksheet, students examine given business situations and determine the probability of an event. They create tree diagrams and contingency tables. This nine-page worksheet contains 7 multi-step problems.
Annenberg Foundation
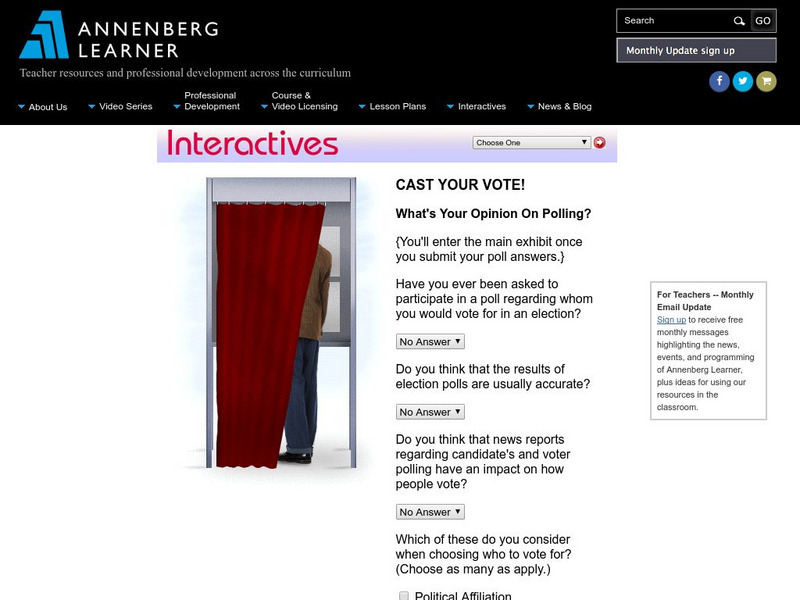
Annenberg Learner: Interactives: Cast Your Vote!
Upper elementary, middle, and high school students can use this exhibit to get an understanding of how polls and elections are conducted. The discussion includes random samples, margins of error, and other concepts related to statistics.
Khan Academy
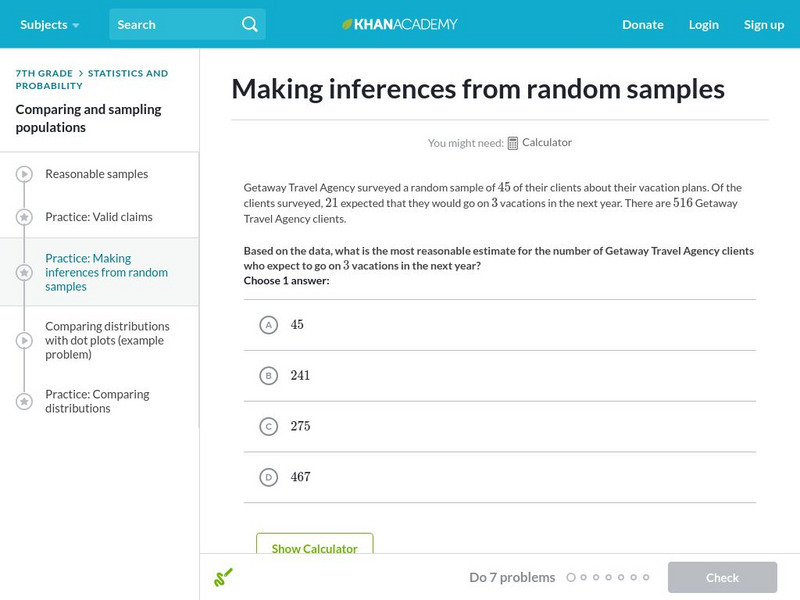
Khan Academy: Making Inferences From Random Samples
Practice making inferences from random samples.
Illustrative Mathematics
Illustrative Mathematics: s.ic.4 the Marble Jar
Sometimes hotels, malls, banks, and other businesses will present a display of a large, clear container holding a large number of items and ask customers to estimate some aspect of the items in the container as a contest. In some cases,...
University of New Brunswick (Canada)
University of New Brunswick: Sample, Random, Systematic, Stratified Sampling
This site contains explanations and examples of the different kinds of data sampling.
Illustrative Mathematics
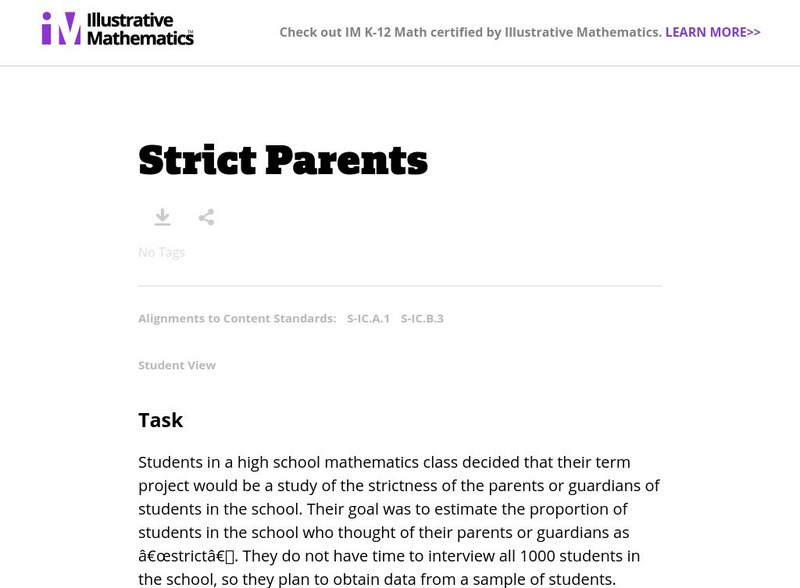
Illustrative Mathematics: S Ic Strict Parents
In this task, students want to estimate the proportion of students in the school who thought of their parents as "strict". They do not have time to interview all 1000 students, so they plan to obtain data from a sample of students....
Louisiana Department of Education
Louisiana Doe: Louisiana Believes: Eureka Math Parent Guide: Statistics and Probability
A guide to support parents as they work with their students in statistics and probability.
Web Center for Social Research Methods
Research Methods Knowledge Base: Probability Sampling
This site from Cornell University contains great information on random or probability sampling. Definitely a site worth checking out on the subject.
University of Georgia
University of Georgia: Inter Math: Sample
This site gives a description of a sample (of a population). The page offers information on various types of sampling. There are links to related terms, everyday examples, more information, and the interactive check point involving...
Education Place
Houghton Mifflin: Eduplace: Math Steps: What Is It? Data
This is a great place for lesson information on the concept of analyzing data - measures of central tendency. Three other tabs are available besides the "What Is It?" link. Tips and Tricks, When Students Ask, and Lesson Ideas also...


