Hi, what do you want to do?
Curated OER
What's Your Favorite Fruit?
A sweet activity to challenge your first graders! The picture graph displays a class's favorite fruits. Young learners solve various problems with the data, including counting the amounts of each kind of fruit, and interpreting which...
Curated OER
Picture Graphs
An innovative way to practice reading data, as well as the four operations! Three picture graphs prompt first graders to count marbles, books, and pets. They also solve addition and subtraction problems. Additionally, they work on...
Curated OER
A Blast of Math
In this metric measurement worksheet, students solve 20 fill in the blank questions related to metric measurement, converting metric units, area of rectangles, picture graphs, patterns, geometric shapes. Students then convert 9...
Curated OER
Probability and Statistics
Elementary schoolers choose from a host of activities to investigate probability and statistics. They complete worksheets, create 3-D graphs, and play graph bingo. They make weather predictions and list all the possibilities before going...
Curated OER
Hats for Sale
What type of hat do you think sells the best? Elementary learners will use the picture graph provided to answer the comprehension questions. A chart accompanies the picture graph, so youngsters can see the data multiple ways.
Curated OER
Complete the Graphs
First, second, and third graders make pictographs. There are four graphs to complete, and the answer sheet is included. Consider providing your learners with special needs two sets of stickers to use, instead of requiring them to draw...
Curated OER
Make and Read a Picture Graph
What books do you like? Have your learners read and interpret a picture graph detailing a fictional class's favorite books. Consider conducting a survey of your learners' favorite books and plotting the results as a class!
Curated OER
Picture Graphs
Are your youngsters learning how to read picture graphs? Use these five examples to asess your learners' comprehension. Consider rearranging them differently; the presentation is slightly congested.
Curated OER
Read a Picture Graph
It's the Bears vs. the Seals! Who is the season winner? Read this data and have your math class answer the six questions that follow. Consider graphing the chart as a class, or encouraging individuals to graph it before answering the...
Curated OER
Math--Pictures and Bars--Learning About Graphs
What is a graph? What does it tell us? How do you make one? These are all questions that are answered in the included packet. It's a great introduction to graphing for young learners!
Curated OER
The Gathering and Analysis of Data
Young mathematicians gather data on a topic, graph it in various forms, interpret the information, and write a summary of the data. They present their data and graphs to the class.
Curated OER
Statistics Problems
In this statistics activity, 3rd graders answer questions about different graphs including bar graphs, picture graphs, line graphs, and more. Students complete 20 multiple choice questions.
Curated OER
Zoo Favorites
First graders construct a class picture graph and tally grid that show their favorite zoo animals. They discuss the information the graphs show and complete a personal graph based on the class example.
Curated OER
Picture Graphs
First graders work with picture graphs, create their own individual graphs, and construct and read graphs.
Curated OER
Graph It!
First graders use organized data to construct real object graphs, picture graphs, and bar-type graphs.
Texas Instruments
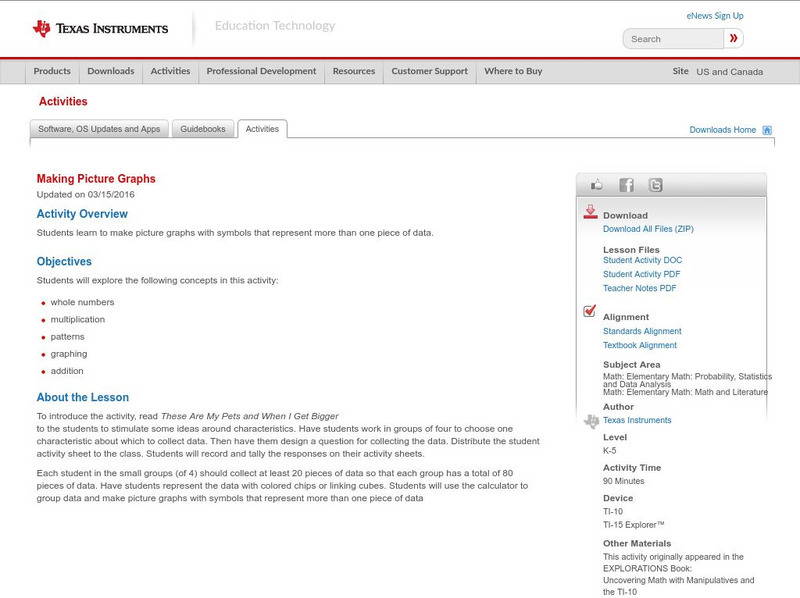
Texas Instruments: Making Picture Graphs
Students learn to make picture graphs with symbols that represent more than one piece of data.
Scholastic
Scholastic: Study Jams! Math: Data Analysis: Pictograph
Watch short video clips that show step by step how to organize data and create a pictograph. Then check for understanding by testing yourself.
Khan Academy
Khan Academy: Solve Problems With Picture Graphs 1
Read and interpret picture graphs. Students receive immediate feedback and have the opportunity to try questions repeatedly, watch a tutorial video, or receive hints.
Khan Academy
Khan Academy: Make Line Plots
Practice creating line plots (dot plots) from data sets. Students receive immediate feedback and have the opportunity to try questions repeatedly, watch a tutorial video, or receive hints.
Khan Academy
Khan Academy: Read Picture Graphs (Multi Step Problems)
Interpret picture graphs to answer questions about a context. Students receive immediate feedback and have the opportunity to try questions repeatedly, watch a video or receive hints.
Illustrative Mathematics
Illustrative Mathematics: 3.oa, Md, Nbt Classroom Supplies
The purpose of this task is for students to solve problems involving the four operations and draw a scaled picture graph and a scaled bar graph to represent a data set with several categories. Aligns with 3.NBT.A.2;...
Khan Academy
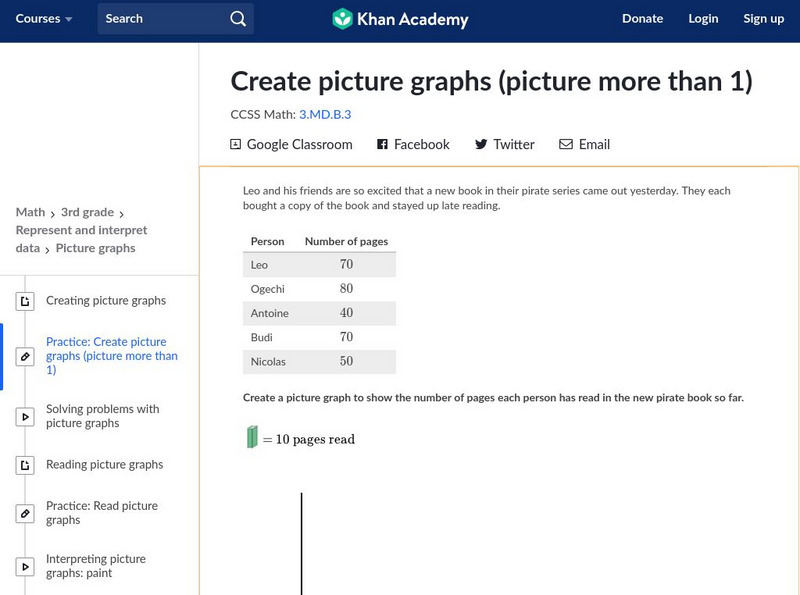
Khan Academy: Create Picture Graphs (Picture More Than 1)
Create and interpret picture graphs. Students receive immediate feedback and have the opportunity to try questions repeatedly, watch a video tutorial, or receive hints about how to create picture graphs. CCSS.Math.Content.3.MD.B.3 Draw a...
Cuemath
Cuemath: Data Handling
This comprehensive guide about data handling helps with understanding how the study of data handling and graphical representation of the data along with other tools help us in dealing with numerical data. Includes solved examples and...


