Hi, what do you want to do?
Curated OER
Explore: Collect And Organize Data
In this exploring how to collect and organize data worksheet, students, working with a partner, problem solve the answers to seven word problems involving data.
Curated OER
Do You Like to Spend or Save?
Students, after briefly discussing spending and saving habits, take a poll to see how their peers like to manage money. Then students graph their findings and discuss the survey results.
City University of New York
Scientific Method and Probability: Interactive Activity
This interactive lesson begins with the basics and carries through to methods of data analysis, all interactively. Supporting material is excellent.
University of Regina (Canada)
University of Regina: Math Central: Atlatl Lessons Grades 4 12
What is an atlatl? Learn how this Aztec dart throwing tool can be used to teach students such things as distance, radius, and linear and angular velocity. Curriculum strands are provided for each of the many lesson plans for students...
University of South Florida
Fcat: Spaghetti Bridges: Teacher Notes
Students build bridges and test their strength to collect data and write an equation. The concept of slope is explored in this activity.
ACT360 Media
Act Den: Microsoft Front Page 98 Tutorial
Are you looking to learn the basics of web page design with Microsoft FrontPage 98? This fun and educational tutorial offers interactive activities and quizzes. The tutorial covers: introduction to FrontPage, creating your first website,...
University of Texas
Inside Mathematics: Our Pets [Pdf]
This task challenges a student to demonstrate understanding of concepts involved in representing and interpreting data.
University of Texas
Inside Mathematics: Parking Cars [Pdf]
This task challenges a student to use their understanding of scale to read and interpret data in a bar graph.
Texas Education Agency
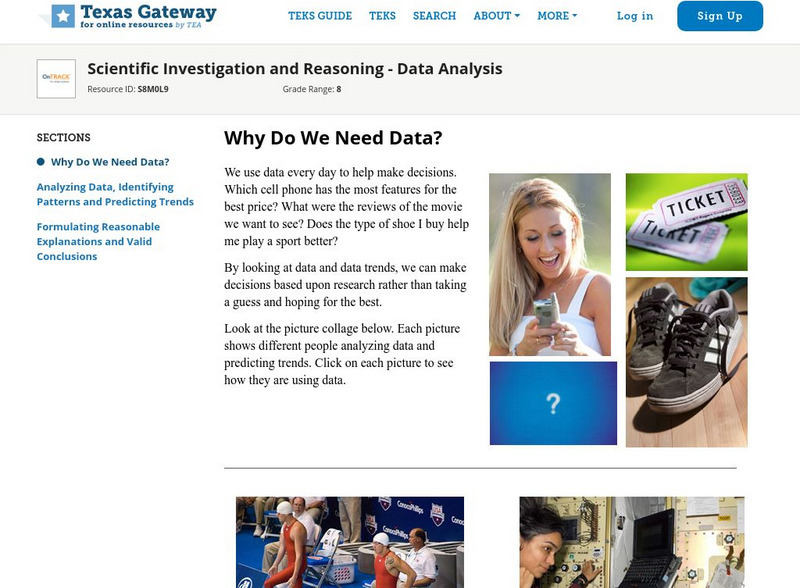
Texas Gateway: Why Do We Need Data?
We use data every day to help make decisions. Which cell phone has the most features for the best price? What were the reviews of the movie we want to see? Does the type of shoe I buy help me play a sport better?By looking at data and...
CK-12 Foundation
Ck 12: Scientific Method (Basic)
[Free Registration/Login may be required to access all resource tools.] This is a basic introduction to the scientifice method that includes links to instructional videos, grade-level texts, interactive activities, and review materials.
CK-12 Foundation
Ck 12: Scientific Method
[Free Registration/Login may be required to access all resource tools.] Instructional videos, grade-level texts, interactive activities, and review material about the scientific method.
National Council of Teachers of Mathematics
The Math Forum: Exploring Ocean Data Lesson Plan
Find "oceans of data" for students of all ages. NCTM, California, and Philadelphia standards are listed for each grade level along with lesson plans and other website resources.
Center for Innovation in Engineering and Science Education, Stevens Institute of Technology
Ciese Real Time Data Projects: Weather Scope: A Study of Weather and Climate
Use real-time data to study factors that affect weather and climate, create weather instruments, and share data with students around the world.
National Council of Teachers of Mathematics
Nctm: Figure This: Math Challenges for Families
Students, teachers, and parents alike will enjoy this challenging math site. It contains a clever brain teaser section plus creative problems related to algebra, geometry, measurement, numbers, statistics, and probability. A Spanish...
Oswego City School District
Regents Exam Prep Center: Displaying Data
Use this lesson, practice exercise, and teacher resource in planning instruction on displaying data. In the lessons, you'll find definitions and examples of ways to collect and organize data, quartiles, and box-and-whisker plots, as well...
Texas Education Agency
Texas Gateway: Annotate and Analyze a Paired Passage: Practice 1
In this lesson, students will read and annotate a pair of texts to make inferences, draw conclusions, and synthesize ideas and details using textual evidence.
Texas Education Agency
Texas Gateway: Annotate and Analyze a Paired Passage: Practice 2
[Accessible by TX Educators. Free Registration/Login Required] In this lesson, students will read and annotate a pair of texts to make inferences, draw conclusions, and synthesize ideas and details using textual evidence.
Texas Education Agency
Texas Gateway: Annotate and Analyze a Paired Passage: Practice 1
In this lesson, students will read and annotate a pair of texts to make inferences, draw conclusions, and synthesize ideas and details using textual evidence. The two texts are side-by-side to better understand them.
Utah Education Network
Uen: Dissolving Sugar Class Science Fair Project
Second graders work together as a class to generate a science fair project.
PBS
Pbs Learning Media: Molly of Denali: Field Guide Family Activity
Use this Field Guide to Birds from the PBS Kids series Molly of Denali to identify and learn more about birds in your neighborhood. Then seek out additional information and create your own pages to add to Molly's guide.
PBS
Pbs Learning Media: Arthur: All About Community
Use these ARTHUR activities to help children understand themselves and those around them. Topics include self-esteem, understanding others, and cultural diversity.
University Corporation for Atmospheric Research
Ucar: Virtual Ballooning to Explore the Atmosphere Activity
In this computer-based virtual lab, students will learn about the layers of Earth's atmosphere by launching virtual balloons to collect temperature and pressure data at various altitudes. Given a limited number of balloon flights,...
Houghton Mifflin Harcourt
Holt, Rinehart and Winston: Homework Help Independent Practice: Samples and Surveys
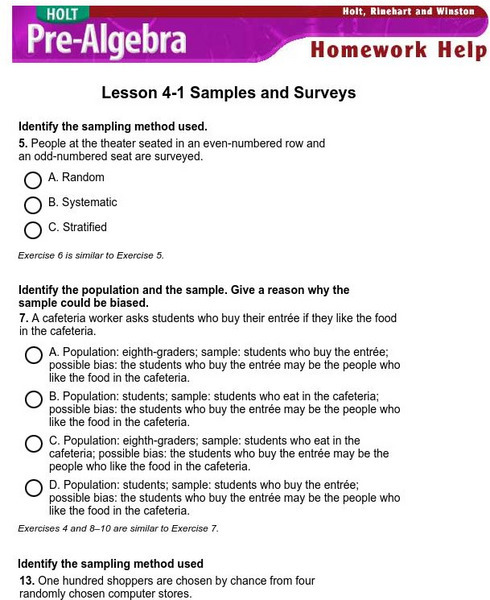
Get independent practice working with samples and surveys. Each incorrect response gets a text box explanation and another try. Correct responses are confirmed.


![Inside Mathematics: Our Pets [Pdf] Lesson Plan Inside Mathematics: Our Pets [Pdf] Lesson Plan](https://static.lp.lexp.cloud/images/attachment_defaults/resource/large/FPO-knovation.png)
