Hi, what do you want to do?
Curated OER
Use Google Maps to Teach Math
Capture the engagement of young mathematicians with this upper-elementary math lesson on measuring time and distance. Using Google Maps, students first measure and compare the distance and time it takes to travel between different...
ProCon
Israeli - Palestinian Conflict
Many people think the best solution to the Israeli-Palestinian conflict is a two-state solution. After reviewing the available resources, scholars determine whether they agree with that approach. They analyze graphs and charts about...
Curated OER
Maryland’s Chesapeake Bay Landscape Long Ago and Today
Combine a fantastic review of primary source analysis with a study of Captain John Smith's influence on the Chesapeake Bay region in the seventeenth century. Your young historians will use images, a primary source excerpt, and maps...
Center for Learning in Action
Investigating Physical and Chemical Changes
Super scientists visit ten stations to predict, observe, and draw conclusions about the physical and chemical changes that occur when different states of matter—liquid, solid, and gas—are placed under a variety of conditions. To...
Center for Learning in Action
Water—Changing States (Part 1)
Here is part one of a two-part lesson in which scholars investigate the changing states of water—liquid, solid, and gas. With grand conversation and up to three demonstrations, learners make predictions about what they think will happen...
Columbus City Schools
What is Up Th-air? — Atmosphere
Air, air, everywhere, but what's in it, and what makes Earth's air so unique and special? Journey through the layers above us to uncover our atmosphere's composition and how it works to make life possible below. Pupils conduct...
Tech Know Teaching
6th Grade Constructed Response Question
Graphs, charts, maps, diagrams. Reading and comprehending informational text is far more than just decoding the words on a page. Here's a packet that provides young readers with practice answering constructed response questions using...
Center for Learning in Action
Density
Explore the concept of density within states of matter—gases, liquids, and solids—through a group experiment in which young scientists test objects' texture, color, weight, size, and ability to sink or float.
Mark Twain Media
Understanding Informational Text Features
Everything you need to know about informational text features can be found in this resource. Recognizing these types of text features and how they are used in text allows readers to better understand information. Teachers...
Virginia Department of Education
Functions 1
Scholars learn what it means for a relation to be a function and see various representations of functions. After learning the definition, they participate in a card sorting activity classifying relations as functions or not.
Consortium for Ocean Science Exploration and Engagement (COSEE)
Climate Change Impacts on Blue King Crabs
Carbon dioxide is not only causing global temperatures to increase, it causes the oceans to become more acidic. Lesson focuses on the blue king crab and the fragility of the habitat due to climate change. Scholars create a concept map...
Center for Learning in Action
Water – Changing States (Part 2)
Here is part two of a two-part lesson in which scholars investigate the changing states of water—liquid, solid, and gas—and how energy from heat changes its molecules. With grand conversation, two demonstrations, and one hands-on...
Center for Learning in Action
Properties of Balls
Enhance your states of matter lessons with a hands-on science investigation that compares six different balls' color, texture, size, weight, ability to bounce, and buoyancy.
Eastconn
Learning to Analyze Political Cartoons with Lincoln as a Case Study
Discover the five main elements political cartoonists use—symbolism, captioning and labels, analogy, irony, and exaggeration—to convey their point of view.
Tech Know Teaching
5th Grade Constructed Response Question
New to constructed response question worksheets? Here's a model that demonstrates how to construct questions that require readers to interpret graphics found in informational text.
Florida Center for Reading Research
Comprehension: Expository Text Structure, Text Feature Find
Scholars explore an expository text to answer questions about its structure.
E-learning for Kids
E Learning for Kids: Math: Elephant Plant: Data and Graphs
On this interactive website students practice various math skills using a real-life scenario involving plants. Those skills include interpreting data in a circle graph, interpreting data in a divided bar graph, and interpreting a bar...
City University of New York
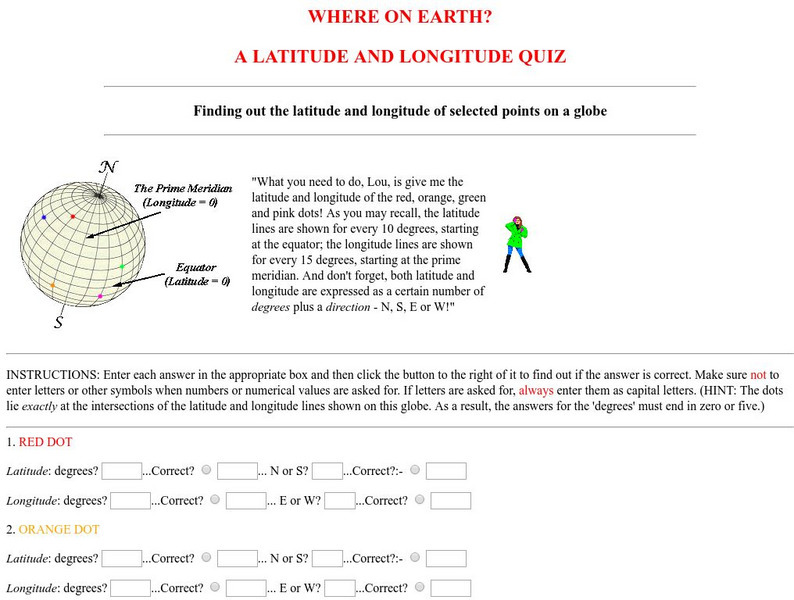
Virtual Geology: Where on Earth: A Latitude and Longitude Quiz
This quiz starts with select points on a globe. Students must determine the latitude, longitude, and direction for each point.
E-learning for Kids
E Learning for Kids: Math: Group of Pyramids: Fractions and Graphs
On this interactive website, students practice various math skills using a real-life scenario at the pyramids. Those skills include showing percentages as fractions and decimals and interpreting data in a sector graph.
Texas Education Agency
Texas Gateway: Evaluate Graphics in Informational/procedural Text
You will learn how to evaluate graphics for their clarity in communicating meaning and achieving a specific purpose.
Sophia Learning
Sophia: Choosing Whether to Use Software or Technology to Enhance Ideas
A tutorial explaining how to use technology to create graphics and visuals to enhance documents and presentations. A brief audiovisual presentation identifies types of visuals, and another audiovisual presentation describes how and when...
Texas Education Agency
Texas Gateway: Synthesize Ideas in Informational/expository Text
[Accessible by TX Educators. Free Registration/Login Required] Learn how to synthesize and make logical connections between ideas within a text and across two or three texts representing similar or different genres and to support the...
E-learning for Kids
E Learning for Kids: Math: Tea Store: Reading a Table
Students will demonstrate how to interpret information in a table.
Florida Center for Reading Research
Florida Center for Reading Research: Exp. Text Structure: Text Feature Find
A lesson plan in which learners look through a book to find various text features including: a table of contents, sequence and format, charts/graphs/maps, diagrams/graphics/illustrations, print variations, an index, and a glossary....


