Virginia Department of Education
Calculating Measures of Dispersion
Double the fun — calculate two measures of deviation. The lesson plan provides information to lead the class through the process of calculating the mean absolute deviation and the standard deviation of a data set. After learning how to...
EngageNY
Using Linear Models in a Data Context
Practice using linear models to answer a question of interest. The 12th installment of a 16-part module combines many of the skills from previous lessons. It has scholars draw scatter plots and trend lines, develop linear models, and...
EngageNY
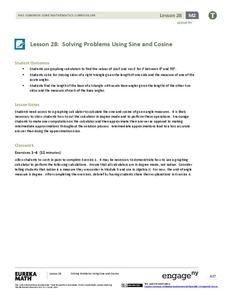
Solving Problems Using Sine and Cosine
Concepts are only valuable if they are applicable. An informative resource uses concepts developed in lessons 26 and 27 in a 36-part series. Scholars write equations and solve for missing side lengths for given right triangles....
Buffalo State
A Five Day Approach to Using Technology and Manipulatives to Explore Area and Perimeter
Young mathematicians build an understanding of area and perimeter with their own two hands in a series of interactive geometry lessons. Through the use of different math manipulatives, children investigate the properties of...
Illustrative Mathematics
How Thick Is a Soda Can I?
The humble soda can gets the geometric treatment in an activity that links math and science calculations. After a few basic assumptions are made and discussed, surface area calculations combine with density information to develop an...
Sea World
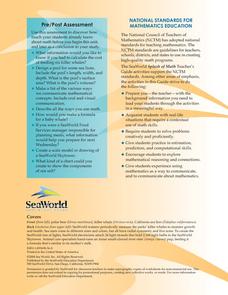
Splash of Math
How can kids use math to learn about marine life? Combine math skills with science lessons in a resource featuring activities about life in the sea. Kids graph and calculate data, solve complex word problems, measure geometric shapes,...
EngageNY
Comparison of Numbers Written in Scientific Notation and Interpreting Scientific Notation Using Technology
Examine numbers in scientific notation as a comparison of size. The 14th lesson in the series asks learners to rewrite numbers as the same power of 10 in scientific notation to make comparisons. Pupils also learn how to use a calculator...
Georgia Department of Education
Math Class
Young analysts use real (provided) data from a class's test scores to practice using statistical tools. Not only do learners calculate measures of center and spread (including mean, median, deviation, and IQ range), but...
Benjamin Franklin High School
Saxon Math: Algebra 2 (Section 3)
In this third of a twelve-part series, the focus moves from using matrices to solving systems of equations with substitution and elimination, including more than two dimensions and variables in equations, and analyzing statistical data....
EngageNY
Making Scale Drawings Using the Ratio Method
Is that drawn to scale? Capture the artistry of geometry using the ratio method to create dilations. Mathematicians use a center and ratio to create a scaled drawing. They then use a ruler and protractor to verify measurements.
Illustrative Mathematics
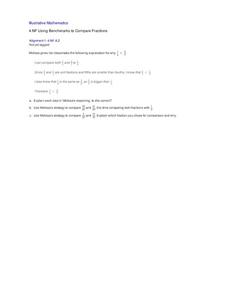
Using Benchmarks to Compare Fractions
Introduce a new strategy for comparing fractions by analyzing Melissa's use of benchmarks. Walk the class through her process, calling on students to explain their understanding of each step she took. Then practice this method on two...
Virginia Department of Education
Radical Equations
Provide students with the skill for how to examine algebraic and graphical approaches to solving radical equations. Learners solve various radical equations involving square root and cube root expressions. They first solve...
University of Missouri
Money Math
Young mathematicians put their skills to the test in the real world during this four-lesson consumer math unit. Whether they are learning how compound interest can make them millionaires, calculating the cost of remodeling...
EngageNY
Truncated Cones
Learners examine objects and find their volumes using geometric formulas in the 21st installment of this 25-part module. Objects take the shape of truncated cones and pyramids, and individuals apply concepts of similar triangles to find...
EngageNY
Using Permutations and Combinations to Compute Probabilities
Now that we know about permutations and combinations, we can finally solve probability problems. The fourth installment of a 21-part module has future mathematicians analyzing word problems to determine whether permutations or...
EngageNY
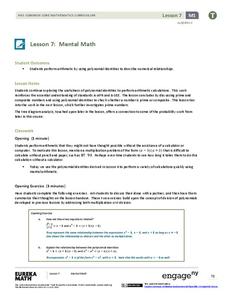
Mental Math
Faster than a speedy calculator! Show your classes how to use polynomial identities to multiply numbers quickly using mental math.
EngageNY
Calculating Conditional Probabilities and Evaluating Independence Using Two-Way Tables (part 1)
Being a statistician means never having to say you're certain! Learners develop two-way frequency tables and calculate conditional and independent probabilities. They understand probability as a method of making a prediction.
EngageNY
Calculating Probabilities of Events Using Two-Way Tables
Tables are useful for more than just eating. Learners use tables to organize data and calculate probabilities and conditional probabilities.
EngageNY
Calculating Conditional Probabilities and Evaluating Independence Using Two-Way Tables (part 2)
Without data, all you are is another person with an opinion. Show learners the power of statistics and probability in making conclusions and predictions. Using two-way frequency tables, learners determine independence by analyzing...
EngageNY
Using Expected Values to Compare Strategies
Discover how mathematics can be useful in comparing strategies. Scholars develop probability distributions for situations and calculate expected value. They use their results to identify the best strategy for the situation.
Illustrative Mathematics
Solar Eclipse
Learners take on the role of astronomers, calculating conditions necessary for a total solar eclipse. Concepts of similar triangles and properties of circles come together as pupils create ratios and use real measurements in determining...
EngageNY
Using a Curve to Model a Data Distribution
Show scholars the importance of recognizing a normal curve within a set of data. Learners analyze normal curves and calculate mean and standard deviation.
EngageNY
Using Sample Data to Estimate a Population Characteristic
How many of the pupils at your school think selling soda would be a good idea? Show learners how to develop a study to answer questions like these! The lesson explores the meaning of a population versus a sample and how to interpret the...
EngageNY
Why Are Vectors Useful? 1
How do vectors help make problem solving more efficient? Math scholars use vectors to represent different phenomenon and calculate resultant vectors to answer questions. Problems vary from modeling airplane motion to the path of a...


