Illustrative Mathematics
Weather Graph Data
Teaching young mathematicians about collecting and analyzing data allows for a variety of fun and engaging activities. Here, children observe the weather every day for a month, recording their observations in the form of a bar graph....
Chicago Botanic Garden
Weather or Not
What is the difference between weather and climate? This is the focus question of a lesson that takes a deeper look at how weather data helps determine climate in a region. Using weather and climate cards, students decide...
Montana State University
What's the Weather?
How many jackets do you need to stay warm and climb Mount Everest? An informatie resource covers the topic of Mount Everest, the resource helps young scientists discover the difference between climate and weather. Activities include...
Chicago Botanic Garden
Historical Climate Cycles
What better way to make predictions about future weather and climate patterns than with actual climate data from the past? Young climatologists analyze data from 400,000 to 10,000 years ago to determine if climate has changed over...
NOAA
Climate, Weather…What’s the Difference?: Make an Electronic Temperature Sensor
What's the best way to record temperature over a long period of time? Scholars learn about collection of weather and temperature data by building thermistors in the fourth installment of the 10-part Discover Your Changing World series....
Laboratory for Atmospheric and Space Physics
Science at 100,000 Feet
Take your class up, up, and away with an engaging weather balloon simulation! Individuals get hands-on experience in creating and launching their own airborne labs to study how temperature and pressure affect substances at 100,000...
Radford University
A Change in the Weather
Explore the power of mathematics through this two-week statistics unit. Pupils learn about several climate-related issues and complete surveys that communicate their perceptions. They graph both univariate and bivariate data and use...
Virginia Department of Education
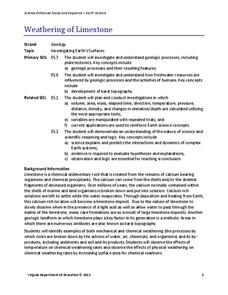
Weathering of Limestone
We all know limestone weathers, but what affects the rate of weathering? Young scientists investigate the physical and chemical weathering of limestone (chalk) through experimentation. First, they conduct trials with different-size...
Living Rainforest
Finding the Rainforests
From Brazil to Indonesia, young scientists investigate the geography and climate of the world's tropical rain forests with this collection of worksheets.
Towson University
Looking Backwards, Looking Forward
How do scientists know what Earth's climate was like millions of years ago? Young environmental scholars discover how researchers used proxy data to determine the conditions present before written record. Grouped pupils gain experience...
Polar Trec
Beacon Valley Weather
In Beacon Valley, katabatic winds regularly knock fit adults to the ground. The lesson compares the actual temperatures to the wind chill after factoring in katabatic winds in Beacon Valley. Scholars learn to calculate wind chill and...
Chicago Botanic Garden
Historical Climate Cycles
Scientists use ice core samples to obtain temperatures of the earth from 400,000 years ago! The third of five lessons instructs pupils to interpret historical climate data to see changes over time. In part I, participants interpret...
Chicago Botanic Garden
Climate Change Around the World
Look at climate change around the world using graphical representations and a hands-on learning simulation specified to particular cities around the world. Using an interactive website, young scientists follow the provided...
Center Science Education
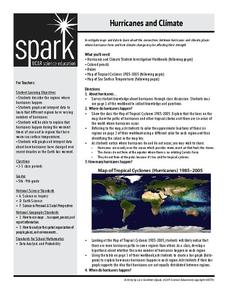
Hurricanes and Climate
Feeling under the weather? This lesson on hurricanes can whip things up! With professionally designed maps and handouts, teach your future weathermen (or women) where, when, and how hurricanes occur. They identify hurricane regions and...
World Wildlife Fund
Land of the Midnight Sun
From days of 24 hour sunlight, to endless nights that last for days, the Arctic is a very unique place to live. Examine the seasonal changes that occur in the northern-most reaches of the globe and the impact they have on the plants and...
Discovery Education
Sonar & Echolocation
A well-designed, comprehensive, and attractive slide show supports direct instruction on how sonar and echolocation work. Contained within the slides are links to interactive websites and instructions for using apps on a mobile device to...
Teach Engineering
Pointing at Maximum Power for PV
Following detailed directions, teams collect the voltage and current outputs of a photovoltaic cell by adjusting the resistance. Using the collected data, they determine the highest power output. Implications for weather and a large...
Polar Trec
What Can We Learn from Sediments?
Varve: a deposit of cyclical sediments that help scientists determine historical climates. Individuals analyze the topography of a region and then study varve datasets from the same area. Using this information, they determine the...
Texas State University
Earth: Deposition and Lithification
Geology geniuses analyze sediment samples with a hand lens and sort according to physical characteristics. They also learn about the processes of cementation, compaction, and lithification within the rock cycle. The lesson plan is...


