Biology Junction
Scientific Method - Controls and Variables
Most teens like to sleep in as late as possible, so testing the fastest way to get to school sounds like a great idea. A presentation walks through how to identify the controls, independent variables, and dependent variables in setting...
EngageNY
Discrete Random Variables
You don't need to be discreet about using the resource on discrete variables. In the fifth installment of a 21-part module, scholars explore random variables and learn to distinguish between discrete and continuous random variables. They...
BW Walch
Creating Linear Equations in One Variable
The example of two travelers meeting somewhere along the road has been a stereotypical joke about algebra as long as algebra has existed. Here in this detailed presentation, this old trope gets a careful and approachable treatment....
BW Walch
Creating and Graphing Linear Equations in Two Variables
This detailed presentation starts with a review of using key components to graph a line. It then quickly moves into new territory of taking these important parts and teasing them out of a word problem. Special care is...
BW Walch
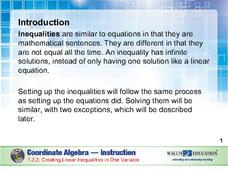
Creating Linear Inequalities in One Variable
Just when a young mathematician starts to feel comfortable turning word problems into linear equations, shake things up and throw inequalities in the mix. This excellent, instructive presentation takes the steps for solving an...
Mathematics Assessment Project
Solving Linear Equations in Two Variables
Solving problems about pen and paper with systems of equations ... or is it the other way around? In the lesson, learners first interpret expressions and use equations in two variables to solve problems about notebooks and pens. They...
CK-12 Foundation
Graphs of Systems of Linear Inequalities in Two Variables: President Jefferson's Octagonal Home
Mathematically complete a set of blueprints. Using eight linear inequalities, pupils create a blueprint of Thomas Jefferson's home. Individuals graph the linear inequalities and position the solution of the inequalities before...
Flipped Math
Create and Analyze Graphs
Model the world with graphs. Pupils watch and participate in creating graphs to model real-world situations. The presenters stress the importance of a consistent scale and proper labels for the graphs along with identification of the...
Flipped Math
Calculus AB/BC - Introduction to Optimization Problems
Let's get the equation set. Pupils see the importance of setting up an one-variable equation in the first of two lessons on optimization problems. The presenter works four different types of problems before individuals use the included...
Curated OER
Identifying Terms, Factors, and Coefficients
What are terms, factors, and coefficients? This slideshow provides definitions and examples of various parts of algebraic expressions, and provides guided practice problems in writing and identifying parts of algebraic expressions for...
EngageNY
Multi-Step Problems in the Real World
Connect graphs, equations, and tables for real-world problems. Young mathematicians analyze relationships to identify independent and dependent variables. These identifications help create tables and graphs for each situation.
Virginia Department of Education
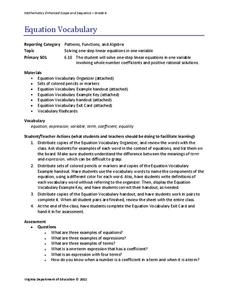
Equation Vocabulary
You'd feel bad if someone called you by the wrong name — and equations are no different. Young mathematicians learn the vocabulary associated with equations and expressions identifying these components in sample equations.
Curated OER
The Psychology Teacher's Resource Guide
The activities in a comprehensive teacher's resource guide provides budding psychologists with opportunities to design experiments to study behavior, apply their knowledge of research variables, critique online behavior surveys, and much...
Flipped Math
Experimental Design
Experimentally, come up with a study design. Learners hear about different types of study designs, observational studies, and experiments. They identify the subjects, response variable, treatment, and whether there was a cause and...
EngageNY
Writing and Evaluating Expressions—Multiplication and Division
Don't table the resource on writing expressions for relationships in tables. Scholars investigate relationships between variables and write algebraic expressions involving multiplication and division. These expressions help solve...
American Chemical Society
Changing State: Evaporation
Why do experiments require a control? Guide scholars through designing an experiment to see what they can do to evaporate water faster with a lesson that stresses the importance of controlling all variables. The second activity...
Federal Reserve Bank
Your Budget Plan
What do Whoosh and Jet Stream have in common? They are both characters in a fantastic game designed to help students identify various positive and negative spending behaviors. Through an engaging activity, worksheets, and...
National Security Agency
Equations and Expressions
Learners demonstrate their knowledge pictorially, concretely, and abstractly in this unit meant to last three hours over three days. Using hands-on activities, manipulatives, real-world applications, and problem...
EngageNY
Writing and Expanding Multiplication Expressions
Find out what's so standard about standard form. Scholars learn to write multiplication expressions with variables in the 10th lesson in a series of 36. They use different symbols for multiplication and translate between standard and...
EngageNY
Interpreting Correlation
Is 0.56 stronger than -0.78? Interpret the correlation coefficient as the strength and direction of a linear relationship between two variables. An algebra instructional activity introduces the correlation coefficient by estimating...
EngageNY
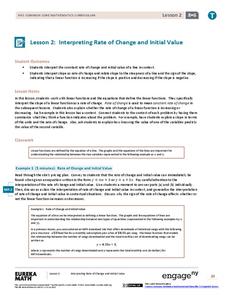
Interpreting Rate of Change and Initial Value
Building on knowledge from the previous activity, the second activity in this unit teaches scholars to identify and interpret rate of change and initial value of a linear function in context. They investigate how slope expresses the...
EngageNY
Patterns in Scatter Plots
Class members investigate relationships between two variables in the seventh installment of a 16-part module that teaches scholars how to find and describe patterns in scatter plots. Young mathematicians consider linear/nonlinear...
EngageNY
From Equations to Inequalities
Sometimes, equality just doesn't happen. Scholars apply their knowledge of solving equations to identify values that satisfy inequalities in the 34th installment of a 36-part module. They test given sets of numbers to find those that are...
West Contra Costa Unified School District
Graphing Exponential Functions
Once you know how to graph y = b^x, the sky's the limit. Young mathematicians learn to graph basic exponential functions and identify key features, and then graph functions of the form f(x) = ab^(x – h) + k from the function f(x) = b^x.


