American Statistical Association
Bear Hugs
Scholars research arm span to determine who gives the best bear hugs. They use data from a national study to find the standard statistics for arm span. It includes mean, median, quartiles, spread, standard deviation, and more.
CK-12 Foundation
Angles of Elevation and Depression: Fly-By Calibration
Determine the distance between two trees from afar. Pupils use an interactive resource to create two right triangles using trees and a plane. They determine the horizontal legs of each triangle to find the distance between the two trees.
West Contra Costa Unified School District
Comparing Data Displays
There is so much more to data than just numbers, and this resource has learners use three methods of comparing data in a multi-faceted lesson. The 21-page packet includes a warm-up, examples, an activity, and assessment for a complete...
K12 Reader
3-D: It’s Not Just for Movies
This two-part reading comprehension exercise asks kids to read a short passage about cubes, rectangular prisms, spheres and pyramids, and then to respond to a series of questions about the article.
Virginia Department of Education
Volume of a Rectangular Prism
Fill the minds of your young mathematicians. A hands-on activity has learners fill in a rectangular prism with unit cubes to determine its volume. the exercise provides a great hands-on way for learners to connect the activity to the...
ARKive
Handling Data: African Animal Maths
Handling and processing data is a big part of what real scientists do. Provide a way for your learners to explore graphs and data related to the animals that live on the African savannah. They begin their analysis by discussing what they...
Cornell University
Constructing and Visualizing Topographic Profiles
Militaries throughout history have used topography information to plan strategies, yet many pupils today don't understand it. Scholars use Legos and a contour gauge to understand how to construct and visualize topographic profiles. This...
Virginia Department of Education
Surface Area of a Rectangular Prism
Wrap up a lesson on surface area with a resource that asks scholars to use the idea of wrapping paper to investigate surface area. They draw representations of rectangular prisms on graph paper to find the areas of the respective...
Wasatch County School District
Context Clues
Using context clues is an effective way to define unfamiliar words. Encourage elementary learners to look at the sentences around the word in question, with a short informative slideshow presentation.
Center for Learning in Action
Properties of Balls
Enhance your states of matter lessons with a hands-on science investigation that compares six different balls' color, texture, size, weight, ability to bounce, and buoyancy.
Charleston School District
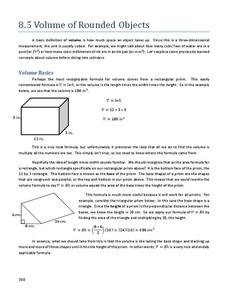
Volume of Rounded Objects
How much can different shapes hold? The answer varies depending on the shape and dimensions. Individuals learn the formulas for the volume of a sphere, cone, and cylinder. They apply the formulas to find the volume of these...
Willow Tree
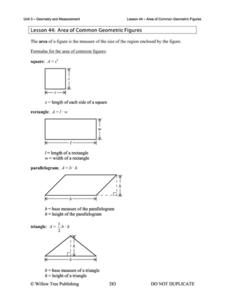
Area of Common Geometric Figures
Scholars can use area formulas, but can they apply what they know about area? The lesson challenges learners to think logically while practicing finding area of shapes such as rectangles, circles, parallelograms, triangles, and other...
Illustrative Mathematics
Mile High
What is the meaning of sea level? This resource helps your class understand the meaning of elevations above, below, and at sea level. Provides for good discussion on using positive and negative numbers to represent quantities in the real...
Government of Hong Kong
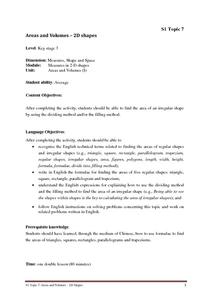
Areas and Volumes - 2D Shapes
Unfortunately for young mathematicians, the world isn't made entirely of parallelograms, triangles, and trapezoids. After first learning the area formulas for these common shapes, students apply this new knowledge to determine the area...
International Technology Education Association
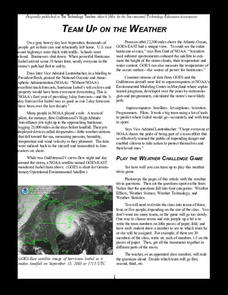
Team Up on the Weather
There's a little bit about every aspect of weather in this trivia game. The lesson resource provides 36 questions and answers pertaining to four different topics related to weather: effects, science, technology, and statistics. Groups...
Batesville Community School Corporation
Energy in a Nutshell
Reduce the work it takes to plan a physics lesson on energy with the help of this instructional presentation. Beginning with clear explanations of kinetic and potential energy, this resource continues on to familiarize young scientists...
Bowels Physics
Light, Reflection, and Mirrors
Explore the connection of light, reflection, and mirrors. A comprehensive lesson introduces the basics of light in relation to reflection and mirrors. After an explanation of the vocabulary, the presentation shows how to create ray...
Virginia Department of Education
z-Scores
Just how far away from the mean is the data point? Pupils calculate the standard deviation for a set of data and find out how many standard deviations a point is away from the mean. The teacher leads a discussion on how to calculate...
Mabry MS Blog
Scatter Plots
Scatter plots are a fun way to gather and collect relevant data. The presentation goes through several examples and then describes the different types of correlation.
Virginia Department of Education
Numbers in a Name
What's in a name? Pupils create a data set from the number of letters in the names of classmates. Each group then takes the data and creates a visual representation, such as a histogram, circle graph, stem-and-leaf plot, etc.
Other popular searches
- Measurement in Height
- Measure Height
- Measure Height With Number Bar
- Measurement in Height Length
- Measure Height of Building
- Measure Head and Height
- Tree Height Measurements


