EngageNY
Discrete Random Variables
You don't need to be discreet about using the resource on discrete variables. In the fifth installment of a 21-part module, scholars explore random variables and learn to distinguish between discrete and continuous random variables. They...
EngageNY
Probability Distribution of a Discrete Random Variable
Learn how to analyze probability distributions. The sixth installment of a 21-part module teaches pupils to use probability distributions to determine the long-run behavior of a discrete random variable. They create graphs of probability...
EngageNY
Expected Value of a Discrete Random Variable
Discover how to calculate the expected value of a random variable. In the seventh installment of a 21-part module, young mathematicians develop the formula for expected value. They connect this concept the dot product of vectors.
CK-12 Foundation
Sums and Differences of Independent Random Variables: Traveling Seasickness
Use a Punnett square to calculate probabilities. The resource presents a situation in which two patients are randomly selected from a group of patients with a particular illness. Pupils use the interactive to determine the likelihood...
CK-12 Foundation
Discrete Random Variables: Roll the Dice!
And the winner is ... not always who it appears to be. An interactive gives the directions for a dice game that on the surface gives one player an advantage over the other. Pupils look closer at the possible outcomes and find the...
EngageNY
Interpreting Expected Value
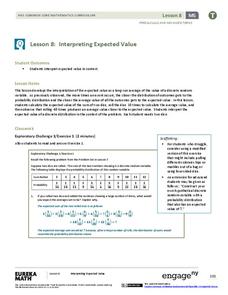
Investigate expected value as a long-run average. The eighth installment of a 21-part module has scholars rolling pairs of dice to determine the average sum. They find aggregate data by working in groups and interpret expected value as...
Flipped Math
Experimental Design
Experimentally, come up with a study design. Learners hear about different types of study designs, observational studies, and experiments. They identify the subjects, response variable, treatment, and whether there was a cause and...
Virginia Department of Education
Inequalities
Compare graphing an inequality in one variable on a number line to graphing an inequality in two variables on a coordinate plane. Young mathematicians work on a puzzle matching inequalities and their solutions. They then complete a...
Science 4 Inquiry
The Ups and Downs of Populations
As the reality of population decline across many species becomes real, pupils learn about the variables related to changes in populations. They complete a simulation of population changes and graph the results, then discuss limiting...
EngageNY
Determining Discrete Probability Distributions 2
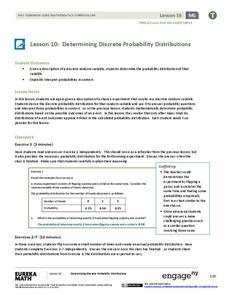
Investigate how long-run outcomes approach the calculated probability distribution. The 10th installment of a 21-part module continues work on probability distributions from the previous lesson. They pool class data to see how conducting...
College Board
Why Variances Add - And Why It Matters
Why is adding variance important? A lesson outline defines a variance theorem and how it affects the data statistics. The instruction shows scholars the importance of considering the variance of data and why it requires independence.
Steinhardt Apps
Kinetic Molecular Theory
Building off young chemists' knowledge of the states of matter, kinetic molecular theory is the focus of the unit. Eight days of lessons including multiple demonstrations, one lab experiment, directed instruction, and worksheets,...
EngageNY
Summarizing Bivariate Categorical Data in a Two-Way Table
Be sure to look both ways when making a two-way table. In the lesson, scholars learn to create two-way tables to display bivariate data. They calculate relative frequencies to answer questions of interest in the 14th part of the series.
NASA
Just How Far is That Star?
Pupils often wonder how we know the distance to various stars. Starting with a thought experiment and progressing to a physical experiment, they determine the brightness and distance to various stars. The evaluation requires critical...
Other popular searches
- Discrete Random Variables
- Binomial Random Variable
- Random Variable Examples
- Non Random Variable
- Random Variable Functions


