Mathematics Vision Project
Quadratic Functions
Inquiry-based learning and investigations form the basis of a deep understanding of quadratic functions in a very thorough unit plan. Learners develop recursive and closed methods for representing real-life situations,...
Illustrative Mathematics
Function Rules
Function machines are a great way to introduce the topic of functions to your class. Here, you will explore the input and output to functions both using numerical and non-numerical data. Learners are encouraged to play with different...
Saxon
Plotting Functions
Youngsters use a graphing calculator to assist in creating a function table. They graph the function on a coordinate plane. They explore the relationship between the domain and range in the graph. This four-page worksheet contains two...
Embedded Math
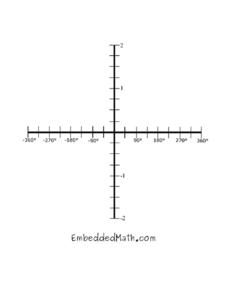
Trig Graph
You and your learners will enjoy having many copies of this trigonometric graph set on the Cartesian coordinate grid with a domain running from -360 degrees to 360 degrees and a range running from -2 to 2.
Curated OER
Your Father
Your learners will explore the idea that not all functions have real numbers as domain and range values as seen in this real-life context. Secondly, the characteristics required for a function to have an inverse are explored including...
Illustrative Mathematics
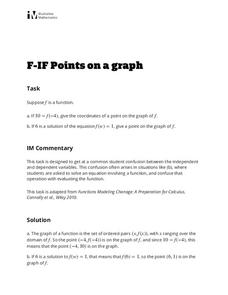
Points on a Graph
Learners practice using their knowledge of how to interpret a function and use function notation. The activity includes two questions. Given an input of a function and its output, the first question asks learners to write the ordered...
Curated OER
Trig Cheat Sheet
Your pre-calculus learners will make use of this wonderful cheat sheet that summarizes all things trigonometric. Definitions based on both the unit circle and the right triangle are included, as well as many convenient trigonometric...
Curated OER
The Random Walk
Deep mathematical thinking is found with just a coin and a number line. Combining computing some probabilities in a discrete situation, and the interpretation of a function, this simple task gives learners a lot to think about on...
Illustrative Mathematics
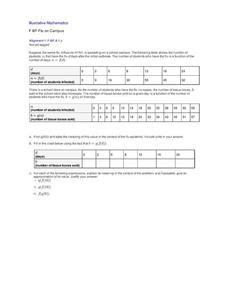
Flu on Campus
An outbreak of the swine flu on a school campus has caused an increase in the number of boxes of tissues sold by the school store. In a real-world-modeling activity, pupils use composition of functions to determine how the number of...
Curated OER
Graphing Inequalities in Two Variables
This study guide is a great resource to help you present the steps to graphing linear inequalities. Show your class two different ways to graph an inequality and work on a real-world example together. The document could also be easily...


