Curated OER
Using Spreadsheets and Graphs
Third graders explore mathematics by utilizing computers. In this graphing lesson, 3rd graders gather class data based on a particular topic such as the "favorite candy" of the class. Students utilize this information and computers to...
Curated OER
WebQuest: Thrills and Spills- Pick Your Park!
Students participate in a WebQuest in which they must determine which amusement park is the "median priced" park. Students visit park websites to accumulate prices for parking, activities, restaurants, and gift shops.
Curated OER
Earth Energy Budget Pre Lab
Students explore energy by conducting an in class experiment. In this climate change activity, students conduct a water vapor experiment in a soda bottle. Students utilize graphs and charts to analyze the results of the experiment and...
Council for Economic Education
Production Possibilities Curve
Demonstrate the important economic principles of the production possibilities curve, including how to calculate opportunity cost and graph curves by using a table or calculation. Learners use a variety of methods, including videos,...
Curated OER
Science: Trouble in the Troposphere
Students research a NASA Website and record information about an assigned city's tropospheric ozone residual monthly climate. In groups, they graph the information for the past year. They form new groups and compare their city's...
Curated OER
The Election Connection
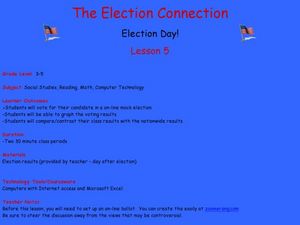
Students participate in a mock election. In this election lesson plan, students vote online in a mock election, graph the results, and compare their results to the nationwide results.
Curated OER
Immigration and Citizenship
Students make graphs showing Canada's immigration patterns over time. Then students play the role of an immigrant seeking citizenship and perform a mock citizenship ceremony.
Curated OER
Properties of the Ocean: Change
Students research and create a visual presentation on the seasonal salinity of the Earth's oceans. They apply the research in a simulation of a lab disaster in which they must relabel ocean samples.
Curated OER
Buy Low, Sell High
Students investigate the stock market and investing in corporate stocks by creating an investment portfolio. They develop database worksheets that track their stock's performance over a specified period of time. Students use their...
Curated OER
Finding Caterpillars
Students examine how animals protect themselves from predators and camouflage themselves. They participate in a simulation in which they locate red and green yarn "caterpillars," organize their data, and generate a bar graph using...
Curated OER
A Cleaner Today for a Greener Tomorrow
Students examine recycling efforts. In this environmental stewardship lesson, students trace recycling efforts and script a skit regarding incandescent light bulbs' effect on the environment.
Curated OER
Stock It To Me
Students investigate the stock market using stock market tables, charts, and graphs. They participate in a simulation of stock market investment over time. They read about the history of Wall Street and the Stock Market.
Curated OER
Small Business
Students simulate owning and running a small business by playing Lemonade Stands. They play the game for three weeks, then work with a partner to produce a Power Point presentation which would be given to a Board of Directors showing...
Curated OER
Nutrition and the Media: Cereal Box Consumerism
How many treats do you buy each week? Learners investigate diets and how the media tricks consumers into purchasing unhealthy snacks. They will investigate the designs and logos affiliated with cereal boxes and identify specific phrases...
Curated OER
Law of Large Numbers - Hospital
Students explore concepts of probability and independent events. They develop a formula for deviation percentage.
Curated OER
Can You Control Floods
Students assume the role of an engineer or planner. As an engineer or planner they must come up with ideas that can be put into place to control floods. They produce a working model of flood control.
Curated OER
Lucky Number
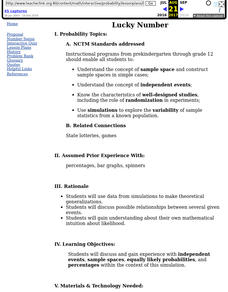
Students use data from simulations to make theoretical generalizations. They discuss possible relationships between several given events and gain understanding about their own mathematical intuition about likelihood.


