Soft Schools
Plot — 3rd or 4th Grade
After reading a version of "The Tortoise and the Hare," scholars complete a plot diagram. They pinpoint the tale's beginning, rising action, climax, falling action, and ending.
National Security Agency
Line Plots: Frogs in Flight
Have a hopping good time teaching your class how to collect and graph data with this fun activity-based lesson series. Using the provided data taken from a frog jumping contest, children first work together...
Curated OER
Box Plots
Young statisticians are introduced to box plots and quartiles. They use an activity and discussion with supplemental exercises to help them explore how data can be graphically represented.
PHET
CME Plotting
Young scientists build on their previous knowledge and apply it to coronal mass ejections. By plotting the path of two different coronal mass ejections, they develop an understanding of why most don't collide with Earth.
PBS
Shakespeare & The Renaissance: Activity Ideas
Looking for ways to implement the words and works of William Shakespeare into your curriculum? This list of activity ideas is a great starting point, as it covers a wide range of grade levels and a wealth of online references to explore.
Curated OER
Scatter-Brained
Seventh graders graph ordered pairs on a coordinate plane. They create a scatterplot. Additionally, they determine the line of best fit and investigate the slope of the line. Multiple resources are provided. An excellent resource!
EngageNY
Practice Planning a Historical Narrative: The Wheelwright
Fourth graders use a four-square graphic organizer to plan a paragraph writing about a wheelwright. Using gathered research from the previous unit, young writers discover how to organize a plot in preparation for writing a historical...
Curated OER
Baseball Relationships - Using Scatter Plots
Students use graphing calculators to create scatter plots of given baseball data. They also determine percentages and ratios, slope, y-intercepts, etc. all using baseball data and statistics.
Curated OER
Scatter Plots
Seventh graders investigate how to make and set up a scatter plot. In this statistics lesson plan, 7th graders collect data and plot it. They analyze their data and discuss their results.
Core Knowledge Foundation
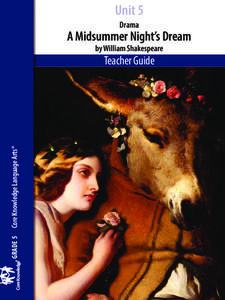
Unit 5: A Midsummer Night’s Dream
Fifth graders analyze William Shakespeare's A Midsummer Night's Dream, paying close attention to character development, plot, and dialogue. With daily reading and thoughtful discussion, scholars take pen to paper to respond to journal...
Curated OER
Language Practice
The simple instructional techniques described in this plan will help young readers learn and practice basic reading skills and strategies. Before reading, introduce your readers to the meaning of main character, setting, and plot. Then...
Curated OER
Story Elements that Support the Theme
Three great graphic organizers guide readers to see how the elements of plot and main idea can be charted to reveal the theme of a story. Model the process on the provided Direct Teaching Teacher Graphic Organizer using Aesop’s The...
Curated OER
Which Story Matches the Given Theme?
Model for young learners how to determine the theme of a story. Read aloud Aesop’s The Fox and the Stork. Chart the plot and the main idea of the fable, showing class members how these elements support the theme. Fable titles for...
Nazareth College
Creative Writing
Students discuss creative writing—what makes something creative writing? Each learner starts writing a story and after 15 minutes, they pass their story to another who adds to it. After another 15 minutes of writing, the story is passed...
Curated OER
Flicking Football Fun
Young mathematicians fold and flick their way to a deeper understanding of statistics with a fun, hands-on math unit. Over the course of four lessons, students use paper footballs to generate data as they learn how to create line...
Curated OER
Button Bonanza
Collections of data represented in stem and leaf plots are organized by young statisticians as they embark some math engaging activities.
Shodor Education Foundation
Simple Coordinates Game
Let coordinate pairs show you the way home. Scholars plot houses on a coordinate plane with given coordinates using an interactive app. Alternatively, they can identify the coordinates of houses already plotted on a coordinate plane.
EdHelper
George Washington's Socks by Elvira Woodruff
A solid, straightforward book report form is an excellent addition to your literature unit. Class members note the main characters, point of view, plot elements, and other important details from a story, adding their favorite part...
Curated OER
The Way to Better Grades!
Pupils collect and analyze data. In this statistics lesson, learners create a scatter plot from their collected data. They use, tables and graphs to analyze the data and mae decisions.
Curated OER
Novel Jeopardy
Play a classroom version of the classic game show Jeopardy, to review and discuss the novel your class has been reading. Questions about plot and other story elements are written on cards and given point values. Divide the class into...
Curated OER
Fire!, Probability, and Chaos
Upper elementary and middle schoolers work with the concept of probability. They are introduced to the concept of chaos. Learners graph and analyze using a line plot, work with mean, and are introduced to the concept of variance.
Curated OER
Mean Absolute Deviation in Dot Plots
The lesson focuses on the ideas of dot plot representations and the mean absolute deviation of data sets.
Curated OER
Reading The Great Kapok Tree
Pupils complete story frames to demonstrate understanding of plot development and conflict resolution.
Curated OER
Who's got the fastest legs?
Students use a stopwatch to collect information for a scatterplot. In this fastest legs lessons, students collect data through the taking of measurements, create and find a median number. Students develop an equation and...
Other popular searches
- Character and Plot Development
- Reading Plot Development
- Stages of Plot Development
- Analyze Plot Development
- Plot Development Art
- Stories Plot Development
- Plot Development in Writing
- Writing, Plot Development
- Plot Development Lesson
- Writing Plot Development


