National Security Agency
Line Plots: Frogs in Flight
Have a hopping good time teaching your class how to collect and graph data with this fun activity-based lesson series. Using the provided data taken from a frog jumping contest, children first work together...
Curated OER
Box Plots
Young statisticians are introduced to box plots and quartiles. They use an activity and discussion with supplemental exercises to help them explore how data can be graphically represented.
Curated OER
Scatter-Brained
Seventh graders graph ordered pairs on a coordinate plane. They create a scatterplot. Additionally, they determine the line of best fit and investigate the slope of the line. Multiple resources are provided. An excellent resource!
Curated OER
Scatter Plots
Seventh graders investigate how to make and set up a scatter plot. In this statistics lesson, 7th graders collect data and plot it. They analyze their data and discuss their results.
Core Knowledge Foundation
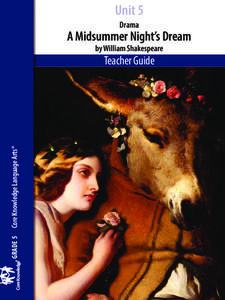
Unit 5: A Midsummer Night’s Dream
Fifth graders analyze William Shakespeare's A Midsummer Night's Dream, paying close attention to character development, plot, and dialogue. With daily reading and thoughtful discussion, scholars take pen to paper to respond to journal...
NASA
Development of a Model: Analyzing Elemental Abundance
How do scientists identify which elements originate from meteorites? Scholars learn about a sample of material found in a remote location, analyzing the sample to determine if it might be from Earth or not. They study elements, isotopes,...
Curated OER
Flicking Football Fun
Young mathematicians fold and flick their way to a deeper understanding of statistics with a fun, hands-on math unit. Over the course of four lessons, students use paper footballs to generate data as they learn how to create line...
Curated OER
Button Bonanza
Collections of data represented in stem and leaf plots are organized by young statisticians as they embark some math engaging activities.
Curated OER
Fire!, Probability, and Chaos
Upper elementary and middle schoolers work with the concept of probability. They are introduced to the concept of chaos. Learners graph and analyze using a line plot, work with mean, and are introduced to the concept of variance.
Curated OER
The Way to Better Grades!
Pupils collect and analyze data. In this statistics lesson, learners create a scatter plot from their collected data. They use, tables and graphs to analyze the data and mae decisions.
Curated OER
Math Lesson: What Do You Want to Know? - Country Statistics
Learners are able to identify the characteristics of a variety of graphs (i.e. bar graph, line graph, pie graph, scatter plot, population pyramids, etc.) They recognize how the type of data to be presented plays a role in choosing the...
Curated OER
Using Data Analysis to Review Linear Functions
Using either data provided or data that has been collected, young mathematicians graph linear functions to best fit their scatterplot. They also analyze their data and make predicitons based on the data. This lesson is intended as a...
Curated OER
Drama: Learn A Lesson from the Lion
Reading is reading, whether it's for drama or English class. Boost reading fluency, accuracy, intonation, and comprehension while fostering creative acting skills. Kids read the provided tale of "The Lion and the Mouse" several times in...
American Statistical Association
What is the Probability of “Pigging Out”
Learners apply their understanding of luck to a probability experiment. They play a game of Pass the Pigs to determine the probability of a specific outcome. Using analysis for their data, pupils declare the measures of center, dot...
Curated OER
Impossible Graphs
Young scholars practice plotting functions on the Cartesian coordinate plane while participating in a discussion about the Possible Or Not worksheet/activity. Students also use the Impossible Graphs worksheet to practice reading a graph,...
Curated OER
Tic Tac Toe, Get Off My Toes
Fourth graders describe the importance of recognizing and forecasting conflict and taking steps to solving it. They analyze conflict situations, follow the steps for solving conflict, and provide solutions involving compromise.
Curated OER
Means of Growth
High schoolers collect and graph data. In this statistics instructional activity, students analyze their plotted data using a scatter plot. They identify lines as having positive, negative or no correlation.
Curated OER
Word Problems
Students solve word problems using mathematical symbols. In this algebra lesson, students collect data and analyze it. They analyze the data using a table or graph after plotting the data.
Curated OER
Analyzing Country Data
Students analyze different data in percentage form. In this statistics lesson, students plot data using box-plots, dotplot, and histogram. They compare and contrast the collected data using the boxplot.
Curated OER
Stem-and- Leaf Plots
Students are introduce to the notion of stem-and-leaf plots. They use stem-and-leaf plots to calculate the mean, median, and mode of a set of data. Students use computers to learn about stem-and-leaf plots.
Curated OER
Learning to Analyze Characters
Learners discover writing strategies authors use to enhance characters. In this character writing lesson, students are read the Knuffle Bunny books by Mo Willems and analyze the story, characters and settings as they listen....
American Statistical Association
Armspans
Young mathematicians collect data on the arm spans of classmates. Then they sort the data by measures of center, spread, and standard deviation. Finally, they compare groups, such as boys and girls, to interpret any differences.
Syracuse City School District
Literary Elements
Address the literary elements in a piece of writing using these materials. The packet includes plenty of resources, and focuses mainly on theme, character, and point of view, with some materials for setting, symbolism, and author's...
Curated OER
Reading Comprehension
In this reading comprehension lesson, 3rd graders read the story Treasury of Literature and complete various comprehension activities. Students answer factual questions about the story, analyze the story using a bubble map, and...


