Virginia Department of Education
Quadratic Curve of Best Fit
Class members create a table of the number of chords that can be drawn given the number of points on a circle. Pupils analyze the data created, find a function to fit to it, and use the function to make further predictions.
Curated OER
Trig Cheat Sheet
Your pre-calculus learners will make use of this wonderful cheat sheet that summarizes all things trigonometric. Definitions based on both the unit circle and the right triangle are included, as well as many convenient trigonometric...
Curated OER
Alice in Fractalland
Take your class on a field trip to Fractalland where they'll learn all about number and shape patterns. Based on Disney's movie Alice in Wonderland, this resource takes young mathematicians on an adventure as they explore patterns in...
Curated OER
Analyzing Discrete and Continuous Data in a Spreadsheet
You are what you eat! Your statisticians keep a log of what they eat from anywhere between a day to more than a week, keeping track of a variety of nutritional information using a spreadsheet. After analyzing their own data, individuals...
Illustrative Mathematics
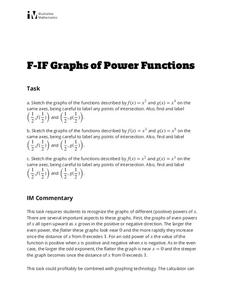
Graphs of Power Functions
This activity consists of three exercises in which learners sketch the graphs of various power functions on the same axes. They use their sketches to make comparisons and observations which lead to generalizations about the graphs of...
Illustrative Mathematics
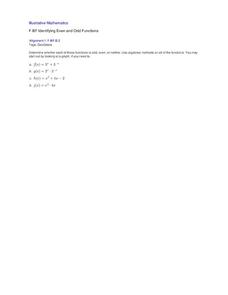
Identifying Even and Odd Functions
Use a worksheet to give learners practice in identifying even and odd functions. The problems on this page are also appropriate for use as assessment items, or you can use them with GeoGebra to interactively present concepts. The task is...
Illustrative Mathematics
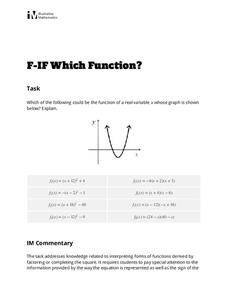
Which Function?
Learners are given a graph of a parabola on a coordinate system, but intercepts and vertex are not labeled. The task is to analyze eight given quadratic functions and determine which ones might possibly be represented by the graph. The...
Virginia Department of Education
Quadratic Modeling
Use a one-stop resource for everything you'd possibly want to teach about quadratic functions and models. Scholars analyze key features of quadratic functions as well as transformations of functions through seven activities....
Illustrative Mathematics
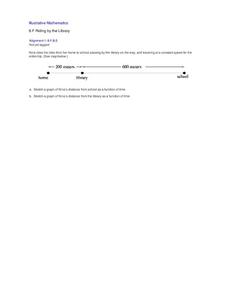
Riding by the Library
Draw a graph that shows the qualitative features of a function that has been described verbally. Make sure learners understand where time is zero and the distance is zero. It may take them some time to understand this concept, so working...
Illustrative Mathematics
Tides
A very simple example of a functional relationship between depth of water and time is shown here. In fact, it might be more useful to use a coastal tide book to better illustrate this real-world experience. Pupils are to count the number...
Curated OER
Your Father
Your learners will explore the idea that not all functions have real numbers as domain and range values as seen in this real-life context. Secondly, the characteristics required for a function to have an inverse are explored including...
Illustrative Mathematics
Rainfall
Find the how long it has been raining based upon the amount of rainfall. Scholars analyze a table of the amount of rainfall as a function of time. Pupils first determine whether the function is invertible, then they find and interpret...
Mathematics Vision Project
Connecting Algebra and Geometry
Connect algebra and geometry on the coordinate plane. The eighth unit in a nine-part integrated course has pupils develop the distance formula from the Pythagorean Theorem. Scholars prove geometric theorems using coordinates including...
Illustrative Mathematics
Chicken and Steak, Variation 2
Many organizations put on barbecues in order to make money. In a real-world math problem, the money allotted to purchase steak and chicken at this barbecue is only one hundred dollars. It is up to your potential chefs to figure out how...
Illustrative Mathematics
Velocity vs. Distance
At the end of this activity, your number crunchers will have a better understanding as to how to describe graphs of velocity versus time and distance versus time. It is easy for learners to misinterpret graphs of velocity, so have them...
Curated OER
Equal Differences Over Equal Intervals 1
Learners explore linear functions concretely using tables of values in a cooperative task. The concept of the values of linear functions changing by equal differences over equal intervals of one is emphasized. Learners will discover the...
Curated OER
Cell Phones
Your texters will enjoy assessing their knowledge of function notation in this simple set of exercises. They will also interpret function notation in terms of the given context.
Curated OER
Equal Differences Over Equal Intervals 2
Your algebra learners explore linear functions concretely using tables of values in a collaborative task. The idea that linear function values change by equal differences over equal intervals, is emphasized. The slope and y-intercept...
Curated OER
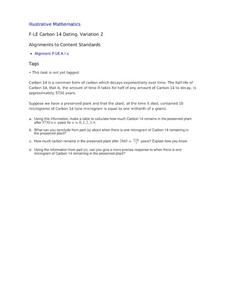
Carbon 14 Dating, Variation 2
Your archaeologists begin this task with a table of values to estimate the time passed based on the half-life of Carbon 14 remaining in a plant. They then move on to find when a specific amount of Carbon 14 is present in the same plant,...
Curated OER
Equal Factors Over Equal Intervals
Exponential functions and their growth rates are explored concretely using tables in a collaborative task. Then the successive quotient is explored algebraically.
Curated OER
Rumors
Your young gossipers write an exponential function for the number of people who have heard a rumor after a number of days have passed. Learners then answer a series of questions, including whether or not the solutions are realistic by...
Illustrative Mathematics
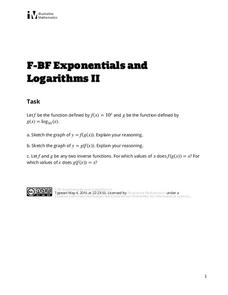
Exponentials and Logarithms II
A simple question sometimes is the best for discussion. High schoolers compare a logarithmic and exponential function and composite them into one another. They graph and compare the difference between the domains. The solution contains...
Curated OER
Interpreting Graphs
Sixth graders interpret linear and nonlinear graphs. They create graphs based on a problem set. Next, they represent quantitive relationships on a graph and write a story related to graphing.
Curated OER
Comparing Exponentials
Growing money exponentially is the context of this scenario that asks learners to compare investments in two certificate of deposit accounts. Your young investment analysts will learn about the exponential characteristics of money...
Other popular searches
- Math Functions Quadratic
- Math Functions Domain Range
- In/out Math Functions
- Math Functions and Patterns
- Math Functions Egg Carton
- Math Functions Spaghetti
- Math Functions Bridge
- Math Functions Rounding
- Composite of Math Functions
- Math Functions Quadractic
- Functions Math
- Linear Functions Math Models


