Curated OER
Historical Population Changes in the US
Students conduct research on historical population changes in the U.S. They conduct Internet research on the Historical Census Data Browser, create a bar graph and data table using a spreadsheet program, and display and interpret their...
US Department of Commerce
Changes in My State
So much can change in seven years. Young statisticians choose three types of businesses, such as toy stores and amusement parks, and use census data to determine how the number of those businesses in their state changed between 2010 to...
Curated OER
A Class Census
Students recognize that data represents specific pieces of information about real-world activities, such as the census. In this census lesson, students take a class and school-wide census and construct tally charts and bar graphs to...
Curated OER
Then and Now
Students conduct research and use census data to compare different times and places. In this census instructional activity, students interpret data from charts and graphs, comparing census information from two time periods as well as...
Curated OER
Role-Playing Jean Talon
Students explore New France. In this New France instructional activity, students examine census data compiled by Jean Talon in 1665 and 1666. Students take on the role of Talon trying to convince the King of France to increase his...
Curated OER
Time Changes Everything
Young scholars analyze census data from 1915, 1967 and 2006. They read an article about how the world's population is growing at an alarming rate. They use primary source documents to create a timeline on the information they gathered....
Curated OER
Census Data and New Hampshire History
Students graph the population growth of New Hampshire using historical census data.
Curated OER
Census Sensibility
Students examine the importance of the census and census data collection methods. They gather statistical data, create graphs comparing state and national populations, and compose written reflections on why the census is necessary.
Curated OER
Census Statistics and Graphing
Students graphically represent data from the Census. In this middle school mathematics lesson, students investigate the housing characteristics of different tribes of Native Americans and compare them to the average American...
Curated OER
Analysing 2001 Census Microdata
Eighth graders examine the census data of 2001. In this American History lesson, 8th graders analyze data using one- and two-variable statistical analysis. Students develop a research question that makes use of the...
Curated OER
Cities
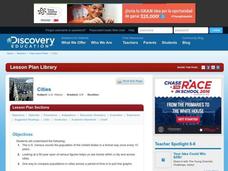
Students examine U.S. Census figures. In this urban centers lesson, students compare city populations across the span of 50 years. Students create line graphs based on the data.
Curated OER
Graphically Speaking
Students discover the links between population and Congressional representation. In this government lesson, students research population statistics and create spreadsheets that compare population to the number of Congress members per state.
Curated OER
The Immigrant Experience
Students utilize oral histories to discover, analyze, and interpret immigration and migration in the history of the United States. A goal of the unit is fostering a discussion and encouraging students to make meaning of the bigger...
Curated OER
What is the Population Distribution of Cartoon Characters Living On the Pages of Your Newspaper?
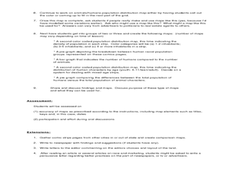
Students read various cartoons in their local newspaper and calculate the population demographics, spatial distribution and grouping of the characters. Using this information, they create a population distribution map and share them with...
Curated OER
Modeling Population Growth
Students investigate the reasons for taking a census and determine the problems that are involved in the process. They examine the population figure for Montana and Lake county before using the information to complete the included...
Curated OER
The First Nations, Métis, and Inuit Peoples of Canada
Students explore demographic shifts. In this Canadian Census lesson, students interpret data from the 2006 Census to determine the needs of the Aboriginal population in the country.
Curated OER
Pop Clock
Students review the Census Bureau's Homepage, gather information regarding population trends in order to make predictions on future populations.
Curated OER
Chinese immigrants in British Columbia, 1870
Learners create graphs and tables on the number of Chinese in British Columbia according to 1870 Census data. They analyze the data and complete worksheets in small groups and then discuss their conclusions as a class.
Curated OER
Eerie Indiana!
Eleventh graders research the population for ten cities in their state, in this example, Indiana, using census information. They design a spreadsheet using the data and create a bar graph with the data. They complete follow up questions.
Curated OER
Population Pyramids
Students utilize population pyramids to answer questions, make comparisons, draw conclusions and support predictions about the populations of China, India and the Unites States. They arrange numbers and symbolic information from various...
Curated OER
Keypals and You
Students collect and compare data received from keypals. They use electronic mail to exchange information with keypals and rrite a paper comparing similarities and differences between themselves and their keypals. In addition, use a...
Curated OER
Picture a Nation
Students research immigration data from a specific time period. They create a graphic organizer that depicts the information and share the information with the class.
Curated OER
Patterns of Settlement in Early Alabama
Fourth graders study the settlement of Alabama. They collect data from the U.S. census website and answer questions regarding settlement patterns in the counties of Alabama in 1820. They write a paagraph describing where they would have...
Curated OER
Making a Cartogram
Students interpret statistical geographic information by creating a cartogram.


